Honeywell 2009 Annual Report Download - page 70
Download and view the complete annual report
Please find page 70 of the 2009 Honeywell annual report below. You can navigate through the pages in the report by either clicking on the pages listed below, or by using the keyword search tool below to find specific information within the annual report.-
 1
1 -
2
-
3
-
4
-
5
-
6
-
7
-
8
-
9
-
10
-
11
-
12
-
13
-
14
-
15
-
16
-
17
-
18
-
19
-
20
-
21
-
22
-
23
-
24
-
25
-
26
-
27
-
28
-
29
-
30
-
31
-
32
-
33
-
34
-
35
-
36
-
37
-
38
-
39
-
40
-
41
-
42
-
43
-
44
-
45
-
46
-
47
-
48
-
49
-
50
-
51
-
52
-
53
-
54
-
55
-
56
-
57
-
58
-
59
-
 60
60 -
 61
61 -
 62
62 -
 63
63 -
 64
64 -
 65
65 -
 66
66 -
 67
67 -
 68
68 -
 69
69 -
 70
70 -
 71
71 -
 72
72 -
 73
73 -
 74
74 -
 75
75 -
 76
76 -
 77
77 -
 78
78 -
 79
79 -
 80
80 -
81
-
82
-
83
-
84
-
85
-
86
-
87
-
88
-
89
-
90
-
91
-
92
-
93
-
94
-
95
-
96
-
97
-
98
-
99
-
100
-
101
-
102
-
103
-
104
-
105
-
106
-
107
-
108
-
109
-
110
-
111
-
112
-
113
-
114
-
115
-
116
-
117
-
118
-
119
-
120
-
121
-
122
-
123
-
124
-
125
-
126
-
127
-
128
-
129
-
130
-
131
-
132
-
133
-
134
-
135
-
136
-
137
-
138
-
139
-
140
-
141
-
142
-
143
-
144
-
145
-
146
-
147
-
148
-
149
-
150
-
151
-
152
-
153
-
154
-
155
-
156
-
157
-
158
-
159
-
160
-
161
-
162
-
163
-
164
-
165
-
166
-
167
-
168
-
169
-
170
-
171
-
172
-
173
-
174
-
175
-
176
-
177
-
178
-
179
-
180
 |
 |

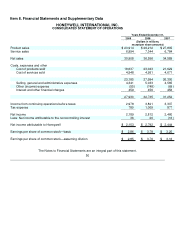
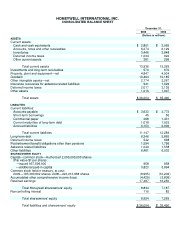
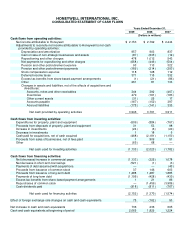
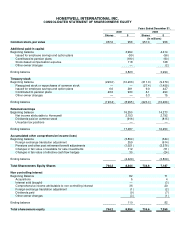
Item 8. Financial Statements and Supplementary Data
HONEYWELL INTERNATIONAL INC.
CONSOLIDATED STATEMENT OF OPERATIONS
Years Ended December 31,
2009 2008 2007
(Dollars in millions,
except per share amounts)
Product sales $ 23,914 $ 29,212 $ 27,805
Service sales 6,994 7,344 6,784
Net sales 30,908 36,556 34,589
Costs, expenses and other
Cost of products sold 18,637 23,043 21,629
Cost of services sold 4,548 4,951 4,671
23,185 27,994 26,300
Selling, general and administrative expenses 4,341 5,033 4,565
Other (income) expense (55) (748) (69)
Interest and other financial charges 459 456 456
27,930 32,735 31,252
Income from continuing operations before taxes 2,978 3,821 3,337
Tax expense 789 1,009 877
Net income 2,189 2,812 2,460
Less: Net income attributable to the noncontrolling interest 36 20 (16)
Net income attributable to Honeywell $ 2,153 $ 2,792 $ 2,444
Earnings per share of common stock—basic $ 2.86 $ 3.79 $ 3.20
Earnings per share of common stock—assuming dilution $ 2.85 $ 3.76 $ 3.16
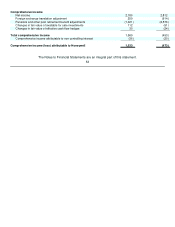
The Notes to Financial Statements are an integral part of this statement.
50