Honeywell 2009 Annual Report Download - page 54
Download and view the complete annual report
Please find page 54 of the 2009 Honeywell annual report below. You can navigate through the pages in the report by either clicking on the pages listed below, or by using the keyword search tool below to find specific information within the annual report.-
 1
1 -
2
-
3
-
4
-
5
-
6
-
7
-
8
-
9
-
10
-
11
-
12
-
13
-
14
-
15
-
16
-
17
-
18
-
19
-
20
-
21
-
22
-
23
-
24
-
25
-
26
-
27
-
28
-
29
-
30
-
31
-
32
-
33
-
34
-
35
-
36
-
37
-
38
-
39
-
40
-
41
-
42
-
43
-
 44
44 -
 45
45 -
 46
46 -
 47
47 -
 48
48 -
 49
49 -
 50
50 -
 51
51 -
 52
52 -
 53
53 -
 54
54 -
 55
55 -
 56
56 -
 57
57 -
 58
58 -
 59
59 -
 60
60 -
 61
61 -
 62
62 -
 63
63 -
 64
64 -
65
-
66
-
67
-
68
-
69
-
70
-
71
-
72
-
73
-
74
-
75
-
76
-
77
-
78
-
79
-
80
-
81
-
82
-
83
-
84
-
85
-
86
-
87
-
88
-
89
-
90
-
91
-
92
-
93
-
94
-
95
-
96
-
97
-
98
-
99
-
100
-
101
-
102
-
103
-
104
-
105
-
106
-
107
-
108
-
109
-
110
-
111
-
112
-
113
-
114
-
115
-
116
-
117
-
118
-
119
-
120
-
121
-
122
-
123
-
124
-
125
-
126
-
127
-
128
-
129
-
130
-
131
-
132
-
133
-
134
-
135
-
136
-
137
-
138
-
139
-
140
-
141
-
142
-
143
-
144
-
145
-
146
-
147
-
148
-
149
-
150
-
151
-
152
-
153
-
154
-
155
-
156
-
157
-
158
-
159
-
160
-
161
-
162
-
163
-
164
-
165
-
166
-
167
-
168
-
169
-
170
-
171
-
172
-
173
-
174
-
175
-
176
-
177
-
178
-
179
-
180
 |
 |

LIQUIDITY AND CAPITAL RESOURCES
The Company continues to manage its businesses to maximize operating cash flows as the primary source
of liquidity. In addition to our available cash and operating cash flows, additional sources of liquidity include
committed credit lines, short-term debt from the commercial paper market, long-term borrowings, and access to
the public debt and equity markets, as well as the ability to sell trade accounts receivables. We continue to
balance our cash and financing uses through investment in our existing core businesses, acquisition activity,
share repurchases and dividends.
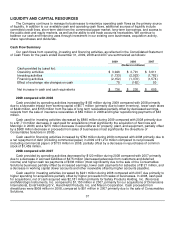
Cash Flow Summary
Our cash flows from operating, investing and financing activities, as reflected in the Consolidated Statement
of Cash Flows for the years ended December 31, 2009, 2008 and 2007 are summarized as follows:
2009 2008 2007
(Dollars in millions)
Cash provided by (used for):
Operating activities $ 3,946 $ 3,791 $ 3,911
Investing activities (1,133) (2,023) (1,782)
Financing activities (2,152) (1,370) (1,574)
Effect of exchange rate changes on cash 75 (162) 50
Net increase in cash and cash equivalents $ 736 $ 236 $ 605
2009 compared with 2008
Cash provided by operating activities increased by $155 million during 2009 compared with 2008 primarily
due to a favorable impact from working capital of $577 million (primarily due to lower inventory), lower cash taxes
of $449 million, and $155 million from the sale of long term receivables partially offset by decreased earnings,
receipts from the sale of insurance receivables of $82 million in 2008 and higher repositioning payments of $43
million.
Cash used for investing activities decreased by $890 million during 2009 compared with 2008 primarily due
to a $1,713 million decrease in cash paid for acquisitions (most significantly the acquisition of Norcross and
Metrolgic in 2008) and a $275 million decrease in expenditures for property, plant, and equipment, partially offset
by a $908 million decrease in proceeds from sales of businesses (most significantly the divestiture of
Consumables Solutions in 2008).
Cash used for financing activities increased by $782 million during 2009 compared with 2008 primarily due to
a net repayment of debt (including commercial paper) in 2009 of $1,272 million compared to net proceeds
(including commercial paper) of $733 million in 2008, partially offset by a decrease in repurchases of common
stock of $1,459 million.
2008 compared with 2007
Cash provided by operating activities decreased by $120 million during 2008 compared with 2007 primarily
due to a decrease in accrued liabilities of $475 million (decreased advances from customers and deferred
income) and higher cash tax payments of $336 million (most significantly due to the sale of the Consumables
Solutions business) partially offset by increased earnings, lower cash payments for asbestos of $121 million, and
a decrease in working capital (lower accounts and other receivable offset by higher accounts payable).
Cash used for investing activities increased by $241 million during 2008 compared with 2007 due primarily to
higher spending for acquisitions partially offset by higher proceeds from sales of businesses. In 2008, cash paid
for acquisitions, net of cash acquired was $2,181 million primarily for Safety Products Holding, Inc. (Norcross)
and Metrologic Instruments, Inc. compared to $1,150 million in 2007, primarily for our acquisitions of Dimensions
International, Enraf Holding B.V., Hand Held Products, Inc, and Maxon Corporation. Cash proceeds from
divestitures were $909 million in 2008, compared to $51 million in 2007 primarily due to the sale of Consumables
Solutions.
37