Honeywell 2009 Annual Report Download - page 65
Download and view the complete annual report
Please find page 65 of the 2009 Honeywell annual report below. You can navigate through the pages in the report by either clicking on the pages listed below, or by using the keyword search tool below to find specific information within the annual report.-
 1
1 -
2
-
3
-
4
-
5
-
6
-
7
-
8
-
9
-
10
-
11
-
12
-
13
-
14
-
15
-
16
-
17
-
18
-
19
-
20
-
21
-
22
-
23
-
24
-
25
-
26
-
27
-
28
-
29
-
30
-
31
-
32
-
33
-
34
-
35
-
36
-
37
-
38
-
39
-
40
-
41
-
42
-
43
-
44
-
45
-
46
-
47
-
48
-
49
-
50
-
51
-
52
-
53
-
54
-
 55
55 -
 56
56 -
 57
57 -
 58
58 -
 59
59 -
 60
60 -
 61
61 -
 62
62 -
 63
63 -
 64
64 -
 65
65 -
 66
66 -
 67
67 -
 68
68 -
 69
69 -
 70
70 -
 71
71 -
 72
72 -
 73
73 -
 74
74 -
 75
75 -
76
-
77
-
78
-
79
-
80
-
81
-
82
-
83
-
84
-
85
-
86
-
87
-
88
-
89
-
90
-
91
-
92
-
93
-
94
-
95
-
96
-
97
-
98
-
99
-
100
-
101
-
102
-
103
-
104
-
105
-
106
-
107
-
108
-
109
-
110
-
111
-
112
-
113
-
114
-
115
-
116
-
117
-
118
-
119
-
120
-
121
-
122
-
123
-
124
-
125
-
126
-
127
-
128
-
129
-
130
-
131
-
132
-
133
-
134
-
135
-
136
-
137
-
138
-
139
-
140
-
141
-
142
-
143
-
144
-
145
-
146
-
147
-
148
-
149
-
150
-
151
-
152
-
153
-
154
-
155
-
156
-
157
-
158
-
159
-
160
-
161
-
162
-
163
-
164
-
165
-
166
-
167
-
168
-
169
-
170
-
171
-
172
-
173
-
174
-
175
-
176
-
177
-
178
-
179
-
180
 |
 |

pending claims based on expected claim resolution values and historic dismissal rates. We also accrue for the
estimated cost of future anticipated claims related to Bendix for the next five years based on our assessment of
additional claims that may be brought against us and anticipated resolution values in the tort system. We value
Bendix pending and future claims using the average resolution values for the previous four years. We will
continue to update the expected resolution values used to estimate the cost of pending and future Bendix claims
during the fourth quarter each year. For additional information see Note 21 to the financial statements. We
continually assess the likelihood of any adverse judgments or outcomes to our contingencies, as well as potential
ranges of probable losses and recognize a liability, if any, for these contingencies based on an analysis of each
individual issue with the assistance of outside legal counsel and, if applicable, other experts.
In connection with the recognition of liabilities for asbestos related matters, we record asbestos related
insurance recoveries that are deemed probable. In assessing the probability of insurance recovery, we make
judgments concerning insurance coverage that we believe are reasonable and consistent with our historical
experience with our insurers, our knowledge of any pertinent solvency issues surrounding insurers, various
judicial determinations relevant to our insurance programs and our consideration of the impacts of any
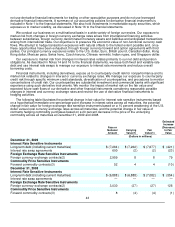
settlements with our insurers. At December 31, 2009, we have recorded insurance receivables of $831 million
that can be specifically allocated to NARCO related asbestos liabilities. We also have $1.9 billion in coverage
remaining for Bendix related asbestos liabilities although there are gaps in our coverage due to insurance
company insolvencies, certain uninsured periods and insurance settlements. Our insurance is with both the
domestic insurance market and the London excess market. While the substantial majority of our insurance
carriers are solvent, some of our individual carriers are insolvent, which has been considered in our analysis of
probable recoveries. Projecting future events is subject to various uncertainties that could cause the insurance
recovery on asbestos related liabilities to be higher or lower than that projected and recorded. Given the inherent
uncertainty in making future projections, we reevaluate our projections concerning our probable insurance
recoveries in light of any changes to the projected liability, our recovery experience or other relevant factors that
may impact future insurance recoveries. See Note 21 to the financial statements for a discussion of
management's judgments applied in the recognition and measurement of insurance recoveries for asbestos
related liabilities.
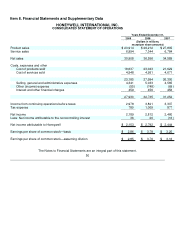
Defined Benefit Pension Plans—We maintain defined benefit pension plans covering a majority of our
employees and retirees. For financial reporting purposes, net periodic pension expense is calculated based upon
a number of actuarial assumptions, including a discount rate for plan obligations and an expected long-term rate
of return on plan assets. We determine the expected long-term rate of return on plan assets utilizing historic and
expected plan asset returns over varying long-term periods combined with current market conditions and broad
asset mix considerations (see Note 22 to the financial statements for details on the actual various asset classes
and targeted asset allocation percentages for our pension plans). The discount rate reflects the market rate on
December 31 (measurement date) for high-quality fixed-income investments with maturities corresponding to our
benefit obligations and is subject to change each year. Further information on all our major actuarial assumption
is included in Note 22 to the financial statements.
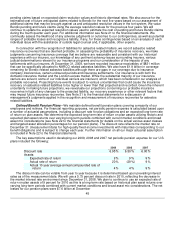
The key assumptions used in developing our 2009, 2008 and 2007 net periodic pension expense for our U.S.
plans included the following:
2009 2008 2007
Discount rate 6.95% 6.50% 6.00%
Assets:
Expected rate of return 9% 9% 9%
Actual rate of return 20% (29%) 9%
Actual 10 year average annual compounded rate of
return 4% 4% 9%
The discount rate can be volatile from year to year because it is determined based upon prevailing interest
rates as of the measurement date. We will use a 5.75 percent discount rate in 2010, reflecting the decrease in
the market interest rate environment since December 31, 2008. We plan to continue to use an expected rate of
return on plan assets of 9 percent for 2010 as this is a long-term rate based on historical plan asset returns over
varying long-term periods combined with current market conditions and broad asset mix considerations. The net
losses for our pension plans were $7.6 billion at December
45