Honeywell 2009 Annual Report Download - page 130
Download and view the complete annual report
Please find page 130 of the 2009 Honeywell annual report below. You can navigate through the pages in the report by either clicking on the pages listed below, or by using the keyword search tool below to find specific information within the annual report.-
 1
1 -
2
-
3
-
4
-
5
-
6
-
7
-
8
-
9
-
10
-
11
-
12
-
13
-
14
-
15
-
16
-
17
-
18
-
19
-
20
-
21
-
22
-
23
-
24
-
25
-
26
-
27
-
28
-
29
-
30
-
31
-
32
-
33
-
34
-
35
-
36
-
37
-
38
-
39
-
40
-
41
-
42
-
43
-
44
-
45
-
46
-
47
-
48
-
49
-
50
-
51
-
52
-
53
-
54
-
55
-
56
-
57
-
58
-
59
-
60
-
61
-
62
-
63
-
64
-
65
-
66
-
67
-
68
-
69
-
70
-
71
-
72
-
73
-
74
-
75
-
76
-
77
-
78
-
79
-
80
-
81
-
82
-
83
-
84
-
85
-
86
-
87
-
88
-
89
-
90
-
91
-
92
-
93
-
94
-
95
-
96
-
97
-
98
-
99
-
100
-
101
-
102
-
103
-
104
-
105
-
106
-
107
-
108
-
109
-
110
-
111
-
112
-
113
-
114
-
115
-
116
-
117
-
118
-
119
-
 120
120 -
 121
121 -
 122
122 -
 123
123 -
 124
124 -
 125
125 -
 126
126 -
 127
127 -
 128
128 -
 129
129 -
 130
130 -
 131
131 -
 132
132 -
 133
133 -
 134
134 -
 135
135 -
 136
136 -
 137
137 -
 138
138 -
 139
139 -
 140
140 -
141
-
142
-
143
-
144
-
145
-
146
-
147
-
148
-
149
-
150
-
151
-
152
-
153
-
154
-
155
-
156
-
157
-
158
-
159
-
160
-
161
-
162
-
163
-
164
-
165
-
166
-
167
-
168
-
169
-
170
-
171
-
172
-
173
-
174
-
175
-
176
-
177
-
178
-
179
-
180
 |
 |

HONEYWELL INTERNATIONAL INC.
NOTES TO FINANCIAL STATEMENTS—(Continued)
(Dollars in millions, except per share amounts)
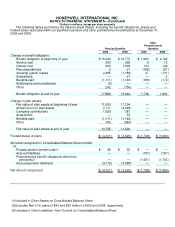
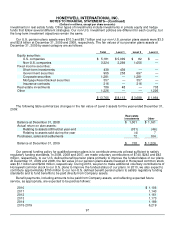
The following tables summarize the balance sheet impact, including the benefit obligations, assets and
funded status associated with our significant pension and other postretirement benefit plans at December 31,
2009 and 2008.
Pension Benefits
Other
Postretirement
Benefits
2009 2008 2009 2008
Change in benefit obligation:
Benefit obligation at beginning of year $ 15,046 $ 16,770 $ 1,960 $ 2,192
Service cost 224 255 6 13
Interest cost 993 1,009 104 122
Plan amendments 2 27 (180) (67)
Actuarial (gains) losses 2,495 (1,186) 47 (131)
Acquisitions — 67 — 3
Benefits paid (1,111) (1,140) (189) (172)
Settlements and curtailments (5) — — —
Other 242 (756) — —
Benefit obligation at end of year 17,886 15,046 1,748 1,960
Change in plan assets:
Fair value of plan assets at beginning of year 11,520 17,194 — —
Actual return on plan assets 2,111 (4,290) — —
Company contributions 1,059 387 — —
Acquisitions — 53 — —
Benefits paid (1,111) (1,140) — —
Other 186 (684) — —
Fair value of plan assets at end of year 13,765 11,520 — —
Funded status of plans $ (4,121) $ (3,526) $ (1,748) $ (1,960)
Amounts recognized in Consolidated Balance Sheet consist
of:
Prepaid pension benefit cost(1) $ 58 $ 62 $ — $ —
Accrued liabilities — — (197) (197)
Postretirement benefit obligations other than
pensions(2) — — (1,551) (1,763)
Accrued pension liability(3) (4,179) (3,588) — —
Net amount recognized $ (4,121) $ (3,526) $ (1,748) $ (1,960)
(1) Included in Other Assets on Consolidated Balance Sheet
(2)
Excludes Non-U.S. plans of $43 and $36 million in 2009 and 2008, respectively.
(3)
Included in Other Liabilities—Non-Current on Consolidated Balance Sheet.