HTC 2009 Annual Report Download - page 97
Download and view the complete annual report
Please find page 97 of the 2009 HTC annual report below. You can navigate through the pages in the report by either clicking on the pages listed below, or by using the keyword search tool below to find specific information within the annual report.-
 1
1 -
2
-
3
-
4
-
5
-
6
-
7
-
8
-
9
-
10
-
11
-
12
-
13
-
14
-
15
-
16
-
17
-
18
-
19
-
20
-
21
-
22
-
23
-
24
-
25
-
26
-
27
-
28
-
29
-
30
-
31
-
32
-
33
-
34
-
35
-
36
-
37
-
38
-
39
-
40
-
41
-
42
-
43
-
44
-
45
-
46
-
47
-
48
-
49
-
50
-
51
-
52
-
53
-
54
-
55
-
56
-
57
-
58
-
59
-
60
-
61
-
62
-
63
-
64
-
65
-
66
-
67
-
68
-
69
-
70
-
71
-
72
-
73
-
74
-
75
-
76
-
77
-
78
-
79
-
80
-
81
-
82
-
83
-
84
-
85
-
86
-
 87
87 -
 88
88 -
 89
89 -
 90
90 -
 91
91 -
 92
92 -
 93
93 -
 94
94 -
 95
95 -
 96
96 -
 97
97 -
 98
98 -
 99
99 -
 100
100 -
 101
101 -
 102
102
 |
 |

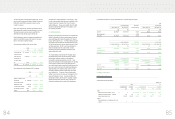
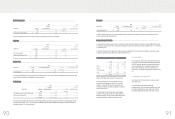
Methodology Used to Determine the Fair Values of Financial Instruments
Fair Values Based on Quoted Market Prices Fair Values Based on Valuation Methods
December 31 December 31
2008 2009 2008 2009
NT$ NT$ US$ (Note 3) NT$ US$(Note 3) US$(Note 3)
Assets
Financial assets at fair value through profit or
loss - current $ - $ 18,132 $ 567 $ - $-$-
Available-for-sale financial assets - current - 2,497,394 78,068 ---
Available-for-sale financial assets - noncurrent 339 313 10 ---
Financial assets carried at cost - --501,192 565,172 17,667
Liabilities
Financial liabilities at fair value through profit or
loss - current 514,083 -- ---
There was no loss or gain recognized for the years ended
December 31, 2008 and 2009 on the fair value changes of
derivatives with fair values estimated using valuation techniques.
However, the Company recognized unrealized losses of NT$445
thousand and NT$26 thousand (US$1 thousand) under
stockholders’ equity for the changes in fair value of
available-for-sale financial assets for the years ended December
31, 2008 and 2009, respectively.
As of December 31, 2008 and 2009, financial assets exposed to
cash flow interest rate risk amounted to NT$60,900,272 thousand
and NT$62,609,630 thousand (US$1,957,162 thousand),
respectively.
As of December 31, 2008 and 2009, financial liabilities exposed to
fair value interest rate risk was NT$75,625 thousand and
NT$46,875 thousand (US$1,465 thousand), respectively.
Financial Risks
a. Market risk
The Company uses derivative contracts for hedging purposes, i.e.,
to reduce any adverse effect of exchange rate fluctuations of
accounts receivable/payable. The gains or losses on these
contracts almost offset the gains or losses on the hedged items.
Thus, market risk is not material.
b.Credit risk
The Company deals only with banks with good credit standing
based on the banks’ reputation and takes into account past
experience with them. Moreover, the Company has a series of
control procedures for derivative transactions. Management
believes its exposure to counter-parties’ default on contracts is low.
c.Cash flow risk
The Company has sufficient working capital to settle derivative
contracts. There are no immediate future cash requirements for
contract settlement.
)LQDQFLDO,QIRUPDWLRQ
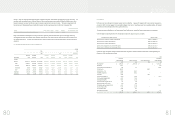
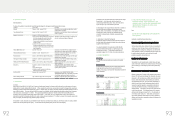
b. Derivative financial instruments
December 31
2008 2009
Carrying Amount Fair Value Carrying Amount Fair Value
NT$ NT$ NT$ US$(Note 3) NT$ US$(Note 3)
Assets
Financial assets at fair value through profit or
loss - current $ - $ - $ 18,132 $ 567 $ 18,132 $ 567
Liabilities
Financial liabilities at fair value through profit
or loss - current 514,077 514,077 ----
Outstanding spot and forward exchange contracts amounted to NT$6 thousand and NT$514,077 thousand, respectively, as of December 31, 2008.
Outstanding forward exchange contracts amounted to NT$18,132 thousand (US$567 thousand) as of December 31, 2009. The net amounts on
derivative financial instruments were recognized as financial assets at fair value through profit or loss - current or financial liabilities at fair value
through profit or loss - current.
Methods and Assumptions Used in Determining Fair Values of Financial Instruments
Not subject to Statement of Financial Accounting Standards No. 34 - “Financial Instruments: Recognition and Measurement” are cash, receivables,
other current financial assets, payables, accrued expenses and other current financial liabilities, which have carrying amounts that approximate their
fair values.
The financial instruments neither include refundable deposits, guarantee deposits nor long-term bank loans. The fair values of aforementioned
financial instruments were based on the present value of future cash flows discounted at the average interest rates for time deposits with maturities
similar to those of the financial instruments.
The fair values of financial instruments at fair value through profit or loss and available-for-sale financial assets are based on quoted market prices
in an active market, and their fair values can be reliably measured. If the securities do not have market prices, fair value is measured on the basis
of financial or other information. The Company uses estimates and assumptions that are consistent with information that market participants
would use in setting a price for these securities.
Financial assets carried at cost are investments in unquoted shares, which have no quoted prices in an active market and entail an unreasonably
high cost to obtain verifiable fair values. Therefore, no fair value is presented.
)LQDQFLDO,QIRUPDWLRQ