HTC 2009 Annual Report Download - page 83
Download and view the complete annual report
Please find page 83 of the 2009 HTC annual report below. You can navigate through the pages in the report by either clicking on the pages listed below, or by using the keyword search tool below to find specific information within the annual report.-
 1
1 -
2
-
3
-
4
-
5
-
6
-
7
-
8
-
9
-
10
-
11
-
12
-
13
-
14
-
15
-
16
-
17
-
18
-
19
-
20
-
21
-
22
-
23
-
24
-
25
-
26
-
27
-
28
-
29
-
30
-
31
-
32
-
33
-
34
-
35
-
36
-
37
-
38
-
39
-
40
-
41
-
42
-
43
-
44
-
45
-
46
-
47
-
48
-
49
-
50
-
51
-
52
-
53
-
54
-
55
-
56
-
57
-
58
-
59
-
60
-
61
-
62
-
63
-
64
-
65
-
66
-
67
-
68
-
69
-
70
-
71
-
72
-
 73
73 -
 74
74 -
 75
75 -
 76
76 -
 77
77 -
 78
78 -
 79
79 -
 80
80 -
 81
81 -
 82
82 -
 83
83 -
 84
84 -
 85
85 -
 86
86 -
 87
87 -
 88
88 -
 89
89 -
 90
90 -
 91
91 -
 92
92 -
 93
93 -
94
-
95
-
96
-
97
-
98
-
99
-
100
-
101
-
102
 |
 |

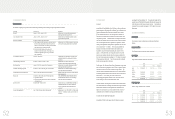
2008 2009
Before Income Tax After Income Tax Before Income Tax After Income Tax
NT$ NT$ NT$ US$ NT$ US$
(Note 3) (Note 3)
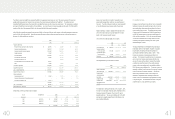
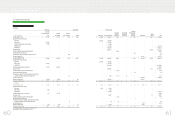
BASIC EARNINGS PER SHARE (Note 25)
$ 39.89 $ 36.16 $ 32.02 $ 1.00 $ 28.71 $ 0.9
DILUTED EARNINGS PER SHARE (Note 25)
$ 38.56 $ 34.95 $ 31.42 $ 0.98 $ 28.18 $ 0.88
(Concluded)
The accompanying notes are an integral part of the consolidated financial statements.
(With Deloitte & Touche audit report dated January 18, 2010)
)LQDQFLDO,QIRUPDWLRQ
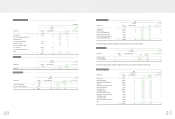
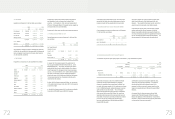
HTC CORPORATION AND SUBSIDIARIES
CONSOLIDATED STATEMENTS OF INCOME
YEARS ENDED DECEMBER 31, 2008 AND 2009
(In Thousands, Except Earnings Per Share)
2008 2009
NT$ NT$
US$
(Note 3)
REVENUES (Notes 2 and 27)
$ 152,353,176 $ 144,492,518 $ 4,516,803
COST OF REVENUES (Notes 4, 10, 23 and 27) 101,362,538 98,329,537 3,073,759
GROSS PROFIT 50,990,638 46,162,981 1,443,044
OPERATING EXPENSES (Notes 23 and 27)
Selling and marketing 9,043,869 10,863,175 339,580
General and administrative 2,250,060 2,304,364 72,034
Research and development 9,351,439 8,372,535 261,724
Total operating expenses 20,645,368 21,540,074 673,338
OPERATING INCOME 30,345,270 24,622,907 769,706
NONOPERATING INCOME AND GAINS
Interest income 1,401,127 362,136 11,320
Gains on disposal of properties 4,521 2,984 93
Gain on sale of investments -3,035 95
Exchange gains (Note 2) 632,969 558,985 17,474
Rental income -5,824 182
Valuation gain on financial instruments, net (Notes 2 and 6) -18,132 567
Other 280,872 468,990 14,661
Total nonoperating income and gains 2,319,489 1,420,086 44,392
NONOPERATING EXPENSES AND LOSSES
Interest expense 10,441 2,174 67
Losses on equity-method investments (Notes 2 and 14) 6,151 3,891 122
Losses on disposal of properties 7,378 2,576 81
Impairment loss (Notes 2 and 14) -78,946 2,467
Valuation loss on financial instruments, net (Notes 2 and 6) 514,083 --
Other (Notes 18 and 27) 390,990 558,994 17,474
Total nonoperating expenses and losses 929,043 646,581 20,211
INCOME BEFORE INCOME TAX 31,735,716 25,396,412 793,887
INCOME TAX (Notes 2 and 24) ( 3,183,190 ) ( 2,781,999 ) ( 86,965 )
NET INCOME $ 28,552,526
$ 22,614,413 $ 706,922
ATTRIBUTABLE TO
Stockholders of the parent $ 28,635,349 $ 22,608,902 $ 706,749
Minority interest ( 82,823 ) 5,511 173
$ 28,552,526 $ 22,614,413 $ 706,922
(Continued)
)LQDQFLDO,QIRUPDWLRQ