HTC 2009 Annual Report Download - page 75
Download and view the complete annual report
Please find page 75 of the 2009 HTC annual report below. You can navigate through the pages in the report by either clicking on the pages listed below, or by using the keyword search tool below to find specific information within the annual report.-
 1
1 -
2
-
3
-
4
-
5
-
6
-
7
-
8
-
9
-
10
-
11
-
12
-
13
-
14
-
15
-
16
-
17
-
18
-
19
-
20
-
21
-
22
-
23
-
24
-
25
-
26
-
27
-
28
-
29
-
30
-
31
-
32
-
33
-
34
-
35
-
36
-
37
-
38
-
39
-
40
-
41
-
42
-
43
-
44
-
45
-
46
-
47
-
48
-
49
-
50
-
51
-
52
-
53
-
54
-
55
-
56
-
57
-
58
-
59
-
60
-
61
-
62
-
63
-
64
-
 65
65 -
 66
66 -
 67
67 -
 68
68 -
 69
69 -
 70
70 -
 71
71 -
 72
72 -
 73
73 -
 74
74 -
 75
75 -
 76
76 -
 77
77 -
 78
78 -
 79
79 -
 80
80 -
 81
81 -
 82
82 -
 83
83 -
 84
84 -
 85
85 -
86
-
87
-
88
-
89
-
90
-
91
-
92
-
93
-
94
-
95
-
96
-
97
-
98
-
99
-
100
-
101
-
102
 |
 |

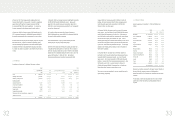
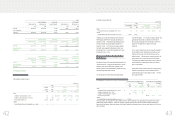
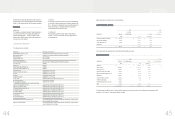
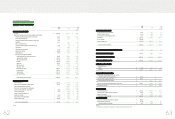
b. Derivative financial instruments
December 31
2008 2009
Carrying Amount Fair Value Carrying Amount Fair Value
NT$ NT$ NT$ US$(Note 3) NT$ US$(Note 3)
Assets
Financial assets at fair value through profit or loss - current $ - $ - $18,132 $567 $18,132 $567
Liabilities
Financial liabilities at fair value through profit or loss - current 514,077 514,077 ----
Outstanding spot and forward exchange contracts amounted to
NT$6 thousand and NT$514,077 thousand, respectively, as of
December 31, 2008. Outstanding forward exchange contracts
amounted to NT$18,132 thousand (US$567 thousand) as of
December 31, 2009. The net amounts on derivative financial
instruments were recognized as financial assets at fair value
through profit or loss - current or financial liabilities at fair value
through profit or loss - current.
Methods and Assumptions Used in Determining Fair Values of
Financial Instruments
Not subject to Statement of Financial Accounting Standards No. 34 -
“Financial Instruments: Recognition and Measurement” are cash,
receivables, other current financial assets, payables, accrued
expenses and other current financial liabilities, which have carrying
amounts that approximate their fair values.
The financial instruments neither include refundable deposits
nor guarantee deposits. The fair values of refundable deposits and
guarantee deposits received are based on the present value of
future cash flows discounted at the average interest rates for time
deposits with maturities similar to those of the financial
instruments.
The fair values of financial instruments at fair value through profit or
loss and available-for-sale financial assets are based on quoted
market prices in an active market, and their fair values can be
reliably measured. If the securities do not have market prices, fair
value is measured on the basis of financial or other information.
The Company uses estimates and assumptions that are consistent
with information that market participants would use in setting a
price for these securities.
Financial assets carried at cost are investments in unquoted shares,
which have no quoted prices in an active market and entail an
unreasonably high cost to obtain verifiable fair values. Therefore,
no fair value is presented.
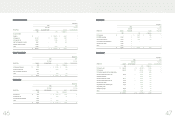
Methodology Used to Determine the Fair Values of Financial Instruments
Fair Values Based on Quoted Market Prices Fair Values Based on Valuation Methods
December 31 December 31
2008 2009 2008 2009
NT$ NT$ US$(Note 3) NT$ US$(Note 3) US$(Note 3)
Assets
Financial assets at fair value through profit or loss - current $ - $ 18,132 $ 567 $-$-$ -
Available-for-sale financial assets - current - 2,497,394 78,068 ---
Available-for-sale financial assets - noncurrent 339 313 10 ---
Financial assets carried at cost - --501,192 501,192 15,667
Liabilities
Financial liabilities at fair value through profit or loss - current 514,083 -----
There was no loss or gain recognized for the years ended December 31, 2008 and 2009 on the fair value changes of derivatives with fair values
estimated using valuation techniques. However, the Company recognized unrealized losses of NT$445 thousand and NT$26 thousand (US$1
thousand) under stockholders’ equity for the changes in fair value of available-for-sale financial assets for the years ended December 31, 2008 and
2009, respectively
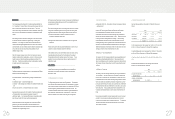
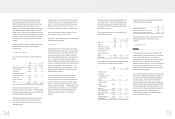
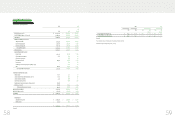
)LQDQFLDO,QIRUPDWLRQ
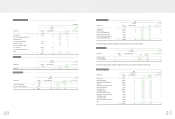
2008
Amount (Numerator) Denominator EPS (In Dollars)
Before Income Tax After Income Tax Shares (Thousands) Before Income Tax After Income Tax
NT$ NT$ NT$ NT$
Basic EPS $31,590,479 $28,635,349 791,855 $39.89 $36.16
Bonus to employees - - 27,400
Diluted EPS $31,590,479 $28,635,349 819,255 $38.56 $34.95
2009
Amount (Numerator) Denominator EPS (In Dollars)
Before Income Tax After Income Tax Shares (Thousands) Before Income Tax After Income Tax
NT$ NT$ NT$ NT$
Basic EPS $25,212,464 $22,608,902 787,367 $32.02 $28.71
Bonus to employees - - 15,044
Diluted EPS $25,212,464 $22,608,902 802,411 $31.42 $28.18
2009
Amount (Numerator) Denominator EPS (In Dollars)
Before Income Tax After Income Tax Shares (Thousands) Before Income Tax After Income Tax
` US$(Note 3) US$(Note 3) US$(Note 3) US$(Note 3)
Basic EPS $788,136 $706,749 787,367 $1.00 $0.90
Bonus to employees - - 15,044
Diluted EPS $788,136 $706,749 802,411 $0.98 $0.88
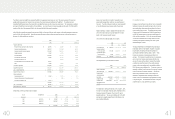
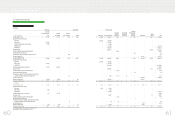
24. FINANCIAL INSTRUMENTS
Fair Value of Financial Instruments
a. Nonderivative financial instruments
December 31
2008 2009
Carrying Fair Carrying Fair
Amount Value Amount Value
NT$ NT$ NT$ US$(Note 3) NT$ US$(Note 3)
Assets
Available-for-sale financial assets - current $ - $ - $2,497,394 $78,068 $2,497,394 $78,068
Available-for-sale financial assets – noncurrent 339 339 313 10 313 10
Financial assets carried at cost 501,192 501,192 501,192 15,667 501,192 15,667
Liabilities
Financial liabilities at fair value through profit or loss – current 6 6 ----
)LQDQFLDO,QIRUPDWLRQ