HTC 2009 Annual Report Download - page 64
Download and view the complete annual report
Please find page 64 of the 2009 HTC annual report below. You can navigate through the pages in the report by either clicking on the pages listed below, or by using the keyword search tool below to find specific information within the annual report.-
 1
1 -
2
-
3
-
4
-
5
-
6
-
7
-
8
-
9
-
10
-
11
-
12
-
13
-
14
-
15
-
16
-
17
-
18
-
19
-
20
-
21
-
22
-
23
-
24
-
25
-
26
-
27
-
28
-
29
-
30
-
31
-
32
-
33
-
34
-
35
-
36
-
37
-
38
-
39
-
40
-
41
-
42
-
43
-
44
-
45
-
46
-
47
-
48
-
49
-
50
-
51
-
52
-
53
-
 54
54 -
 55
55 -
 56
56 -
 57
57 -
 58
58 -
 59
59 -
 60
60 -
 61
61 -
 62
62 -
 63
63 -
 64
64 -
 65
65 -
 66
66 -
 67
67 -
 68
68 -
 69
69 -
 70
70 -
 71
71 -
 72
72 -
 73
73 -
 74
74 -
75
-
76
-
77
-
78
-
79
-
80
-
81
-
82
-
83
-
84
-
85
-
86
-
87
-
88
-
89
-
90
-
91
-
92
-
93
-
94
-
95
-
96
-
97
-
98
-
99
-
100
-
101
-
102
 |
 |
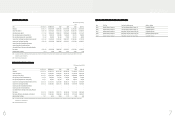
2008 2009
NT$ NT$ US$
(Note 3)
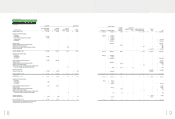
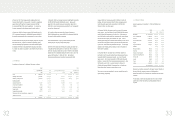
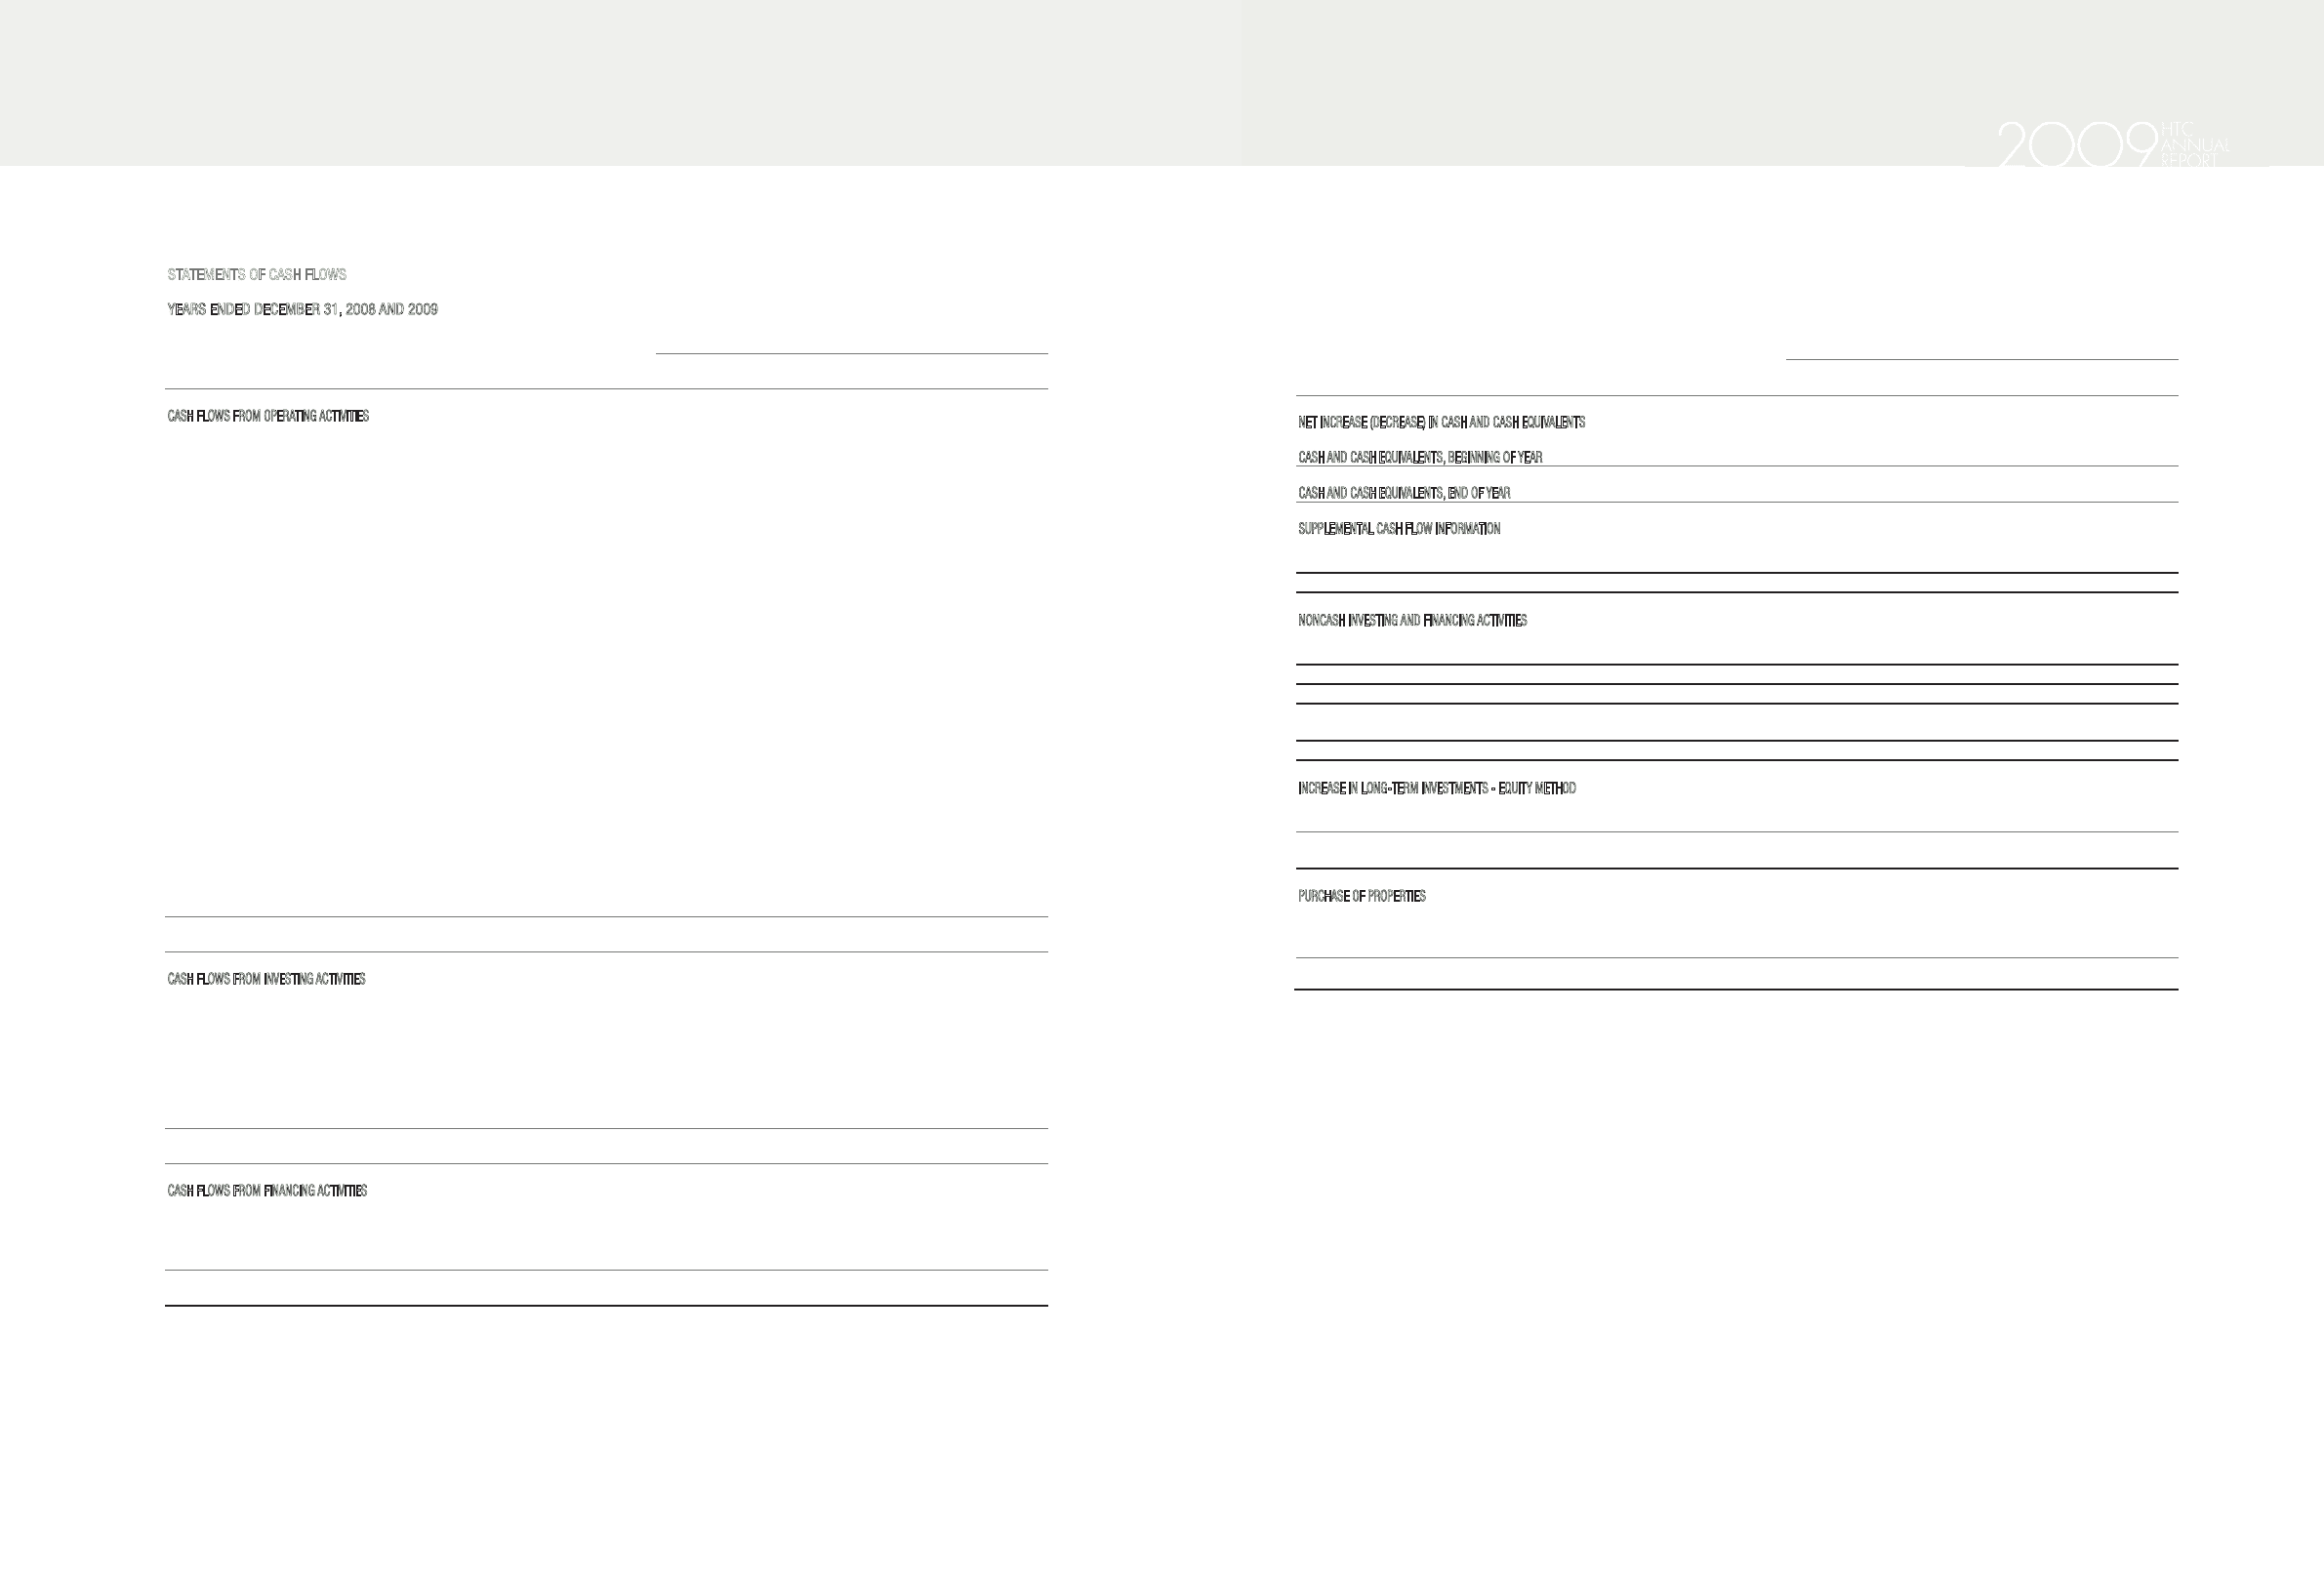
NET INCREASE (DECREASE) IN CASH AND CASH EQUIVALENTS
$ 6,790,641 $ ( 150,409 ) $ ( 4,702 )
CASH AND CASH EQUIVALENTS, BEGINNING OF YEAR
55,036,232 61,826,873 1,932,694
CASH AND CASH EQUIVALENTS, END OF YEAR
$ 61,826,873 $ 61,676,464 $ 1,927,992
SUPPLEMENTAL CASH FLOW INFORMATION
Cash paid during the year
Interest (net of amounts capitalized) $ 232 $ 131 $ 4
Income tax $ 1,963,307 $ 2,892,386 $ 90,415
NONCASH INVESTING AND FINANCING ACTIVITIES
Transfer of bond investment not quoted in an active market to investments
accounted for by the equity method $ 33,030 $ -$ -
Transfer of properties to assets leased to others $ 309,959 $-$-
Transfer of assets leased to others to properties $ - $ 261,824 $ 8,185
Transfer of retained earnings and accrued stock bonuses to employees to
common stock and additional paid-in capital $ 1,822,601 $ 5,327,586 $ 166,538
Retirement of treasury stock $ - $ 5,817,207 $ 181,844
INCREASE IN LONG-TERM INVESTMENTS - EQUITY METHOD
Increase in investments accounted for by the equity method $ 2,231,529 $ 1,137,873 $ 35,570
(Increase) decrease in payable for purchase of investments ( 122,700 ) 26,262 821
Cash paid for increase in long-term investments $ 2,108,829 $ 1,164,135 $ 36,391
PURCHASE OF PROPERTIES
Cost of properties purchased $ 4,564,155 $ 1,336,787 $ 41,788
Decrease in payable for purchase of equipment 12,398 88,880 2,778
Decrease in lease payable 938 1,004 31
Cash paid for purchase of properties $ 4,577,491 $ 1,426,671 $ 44,597
(Concluded)
The accompanying notes are an integral part of the financial statements.
(With Deloitte & Touche audit report dated January 18, 2010)
)LQDQFLDO,QIRUPDWLRQ
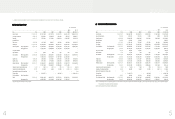
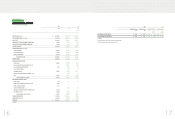
HTC CORPORATION
STATEMENTS OF CASH FLOWS
YEARS ENDED DECEMBER 31, 2008 AND 2009
(In Thousands)
2008 2009
NT$ NT$ US$
(Note 3)
CASH FLOWS FROM OPERATING ACTIVITIES
Net income $ 28,635,349 $ 22,608,902 $ $706,749
Adjustments to reconcile net income to net cash provided by operating
activities
Depreciation (including depreciation of assets leased to others) 568,208 633,950 19,817
Transfer of properties to expenses 18,059 7,021 219
Exchange loss on bond investments not quoted in an active market 2,670 --
Amortization 35,983 39,847 1,246
Gain on sale of investments, net -( 3,035 ) ( 95 )
Loss (gain) on disposal of properties, net 300 ( 2,984 ) ( 93 )
Cash dividends received from equity-method investees - 905 28
Losses (gains) on equity-method investments 57,289 ( 273,811 ) ( 8,559 )
Distribution of bonuses to employees of subsidiaries - ( 17,731 ) ( 554 )
Impairment loss -30,944 967
Deferred income tax assets ( 431,528 ) ( 503,703 ) ( 15,746 )
Prepaid pension costs ( 21,951 ) ( 20,515 ) ( 641 )
Net changes in operating assets and liabilities
Financial instruments at fair value through profit or loss 417,827 ( 532,215 ) ( 16,637 )
Notes and accounts receivable ( 9,913,317 ) 3,534,014 110,472
Accounts receivable from related parties ( 401,895 ) ( 1,305,780 ) ( 40,818 )
Other current financial assets 8,545 41,305 1,291
Inventories ( 1,299,054 ) 2,679,768 83,769
Prepayments 299,696 (2,095,767 ) ( 65,513 )
Other current assets ( 45,166 ) 35,227 1,101
Other assets - other ( 1,843,170 ) ( 57,617 )
Notes and accounts payable 5,887,026 ( 3,024,822 ) ( 94,555 )
Income tax payable 1,423,351 214,879 6,717
Accrued expenses 10,363,107 6,449,927 201,623
Other current liabilities 1,989,656 888,452 27,773
Net cash provided by operating activities 37,594,155 27,541,608 860,944
CASH FLOWS FROM INVESTING ACTIVITIES
Purchase of available-for-sale financial assets - ( 8,105,512 ) ( 253,376 )
Proceeds of the sale of available-for-sale financial assets - 5,611,153 175,403
Purchase of properties ( 4,577,491 ) ( 1,426,671 ) ( 44,597 )
Proceeds of the sales of properties 7,879 4,005 125
Increase in investments accounted for by the equity method ( 2,108,829 ) ( 1,164,135 ) ( 36,391 )
Increase in restricted assets -( 63,900 ) ( 1,997 )
Increase in deferred charges -( 57,495 ) ( 1,797 )
Increase (decrease) in refundable deposits ( 24,027 ) 48,298 1,509
Net cash used in investing activities ( 6,702,468 ) ( 5,154,257 ) ( 161,121 )
CASH FLOWS FROM FINANCING ACTIVITIES
Increase (decrease) in guarantee deposits received 5,778 ( 5,196 ) ( 162 )
Cash dividends ( 19,486,547 ) ( 20,125,634 ) ( 629,123 )
Bonus to employees ( 1,210,000 ) --
Purchase of treasury stock ( 3,410,277 ) ( 2,406,930 ) ( 75,240 )
Net cash used in financing activities ( 24,101,046 ) ( 22,537,760 ) ( 704,525 )
(Continued)
)LQDQFLDO,QIRUPDWLRQ