HTC 2009 Annual Report Download - page 57
Download and view the complete annual report
Please find page 57 of the 2009 HTC annual report below. You can navigate through the pages in the report by either clicking on the pages listed below, or by using the keyword search tool below to find specific information within the annual report.-
 1
1 -
2
-
3
-
4
-
5
-
6
-
7
-
8
-
9
-
10
-
11
-
12
-
13
-
14
-
15
-
16
-
17
-
18
-
19
-
20
-
21
-
22
-
23
-
24
-
25
-
26
-
27
-
28
-
29
-
30
-
31
-
32
-
33
-
34
-
35
-
36
-
37
-
38
-
39
-
40
-
41
-
42
-
43
-
44
-
45
-
46
-
 47
47 -
 48
48 -
 49
49 -
 50
50 -
 51
51 -
 52
52 -
 53
53 -
 54
54 -
 55
55 -
 56
56 -
 57
57 -
 58
58 -
 59
59 -
 60
60 -
 61
61 -
 62
62 -
 63
63 -
 64
64 -
 65
65 -
 66
66 -
 67
67 -
68
-
69
-
70
-
71
-
72
-
73
-
74
-
75
-
76
-
77
-
78
-
79
-
80
-
81
-
82
-
83
-
84
-
85
-
86
-
87
-
88
-
89
-
90
-
91
-
92
-
93
-
94
-
95
-
96
-
97
-
98
-
99
-
100
-
101
-
102
 |
 |

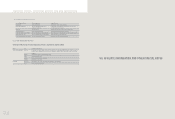
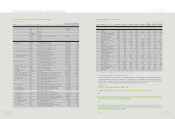
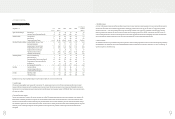
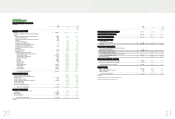
(5) The Name of the Certified Public Accountant and the Auditor's Opinion
Year CPA Firm Certified Public Accountant Auditor's Opinion
2005 Deloitte Touche Tohmatsu Tze-Chun Wang and Kwan-Chung Lai Unqualified Opinion
2006 Deloitte Touche Tohmatsu Tze-Chun Wang and Kwan-Chung Lai Unqualified Opinion
2007 Deloitte Touche Tohmatsu Ming-Hsien Yang and Kwan-Chung Lai Unqualified Opinion
2008 Deloitte Touche Tohmatsu Ming-Hsien Yang and Kwan-Chung Lai Modified Unqualified Opinion
2009 Deloitte Touche Tohmatsu Ming-Hsien Yang and Tze-Chun Wang Unqualified Opinion
)LQDQFLDO,QIRUPDWLRQ
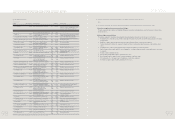
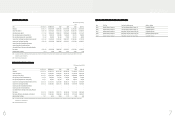
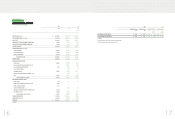
(3) Abbreviated Income Statements
NT$ thousands (Except EPS:NT$)
Year
2010 1QItem 2009(Note 2) 2008(Note 2) 2007 2006 2005
Revenues 144,880,715 152,558,766 118,579,958 104,816,548 72,768,522 37,697,395
Gross Profit (Note 1) 45,862,483 50,641,854 40,177,500 31,322,998 16,007,644 11,440,474
Operating Income (Note 1) 24,174,994 30,256,385 30,535,537 25,820,624 12,259,009 5,511,441
Non-operating Income and Gains (Note 1) 1,623,362 2,300,018 1,810,908 1,234,336 215,271 258,008
Non-operating Expenses and Losses (Note 1) 585,892 965,924 195,148 97,082 318,341 48,905
Income from Continuing Operations before Income Tax 25,212,464 31,590,479 32,151,297 26,957,878 12,155,939 5,720,544
Income from Continuing Operations 22,608,902 28,635,349 28,938,862 25,247,327 11,781,944 4,998,427
Income (Loss) from Discontinued Operations --- ---
Income (Loss) from Extraordinary Items --- ---
Cumulative Effect of Changes in Accounting Principle --- ---
Net Income 22,608,902 28,635,349 28,938,862 25,247,327 11,781,944 4,998,427
Basic Earnings Per Share 28.71 36.16 36.48 31.57 14.85 6.38
Note 1: In accordance with 2008 and 2009 financial reporting requirements, write-downs of inventories or reversal of write-downs and product warranty costs registered during the period 2005 to 2007 have been
reclassified as cost of revenues items.
Note 2: Included employee bonus expenses
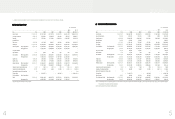
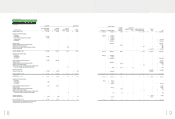
(4) Abbreviated Consolidated Income Statements
NT$ thousands (Except EPS:NT$)
Year
2010 1QItem 2009(Note 2) 2008(Note 2) 2007 2006 2005
Revenues 144,492,518 152,353,176 118,217,545 105,358,397 73,144,654 37,947,114
Gross Profit (Note 1) 46,162,981 50,990,638 44,164,632 32,516,182 17,310,638 11,601,346
Operating Income (Note 1) 24,622,907 30,345,270 30,660,255 25,745,994 12,209,926 5,664,140
Non-operating Income and Gains (Note 1) 1,420,086 2,319,489 1,771,846 1,284,052 233,980 152,286
Non-operating Expenses and Losses (Note 1) 646,581 929,043 200,165 87,329 285,761 56,932
Income from Continuing Operations before Income Tax 25,396,412 31,735,716 32,231,936 26,942,717 12,158,145 5,759,494
Income from Continuing Operations 22,614,413 28,552,526 28,917,712 25,234,342 11,781,944 4,991,684
Income (Loss) from Discontinued Operations --- - --
Income (Loss) from Extraordinary Items --- - --
Cumulative Effect of Changes in Accounting Principle --- - --
Net Income 22,614,413 28,552,526 28,917,712 25,234,342 11,781,944 4,991,684
Net Income Attribute to Shareholders of the Parent 22,608,902 28,635,349 28,938,862 25,247,327 11,781,944 4,998,427
Basic Earnings Per Share 28.71 36.16 36.48 31.57 14.85 6.38
Note 1: In accordance with 2008 and 2009 financial reporting requirements, write-downs of inventories or reversal of write-downs and product warranty costs registered during the period 2005 to 2007 have been
reclassified as cost of revenues items.
Note 2: Included employee bonus expenses
)LQDQFLDO,QIRUPDWLRQ