HTC 2009 Annual Report Download - page 56
Download and view the complete annual report
Please find page 56 of the 2009 HTC annual report below. You can navigate through the pages in the report by either clicking on the pages listed below, or by using the keyword search tool below to find specific information within the annual report.-
 1
1 -
2
-
3
-
4
-
5
-
6
-
7
-
8
-
9
-
10
-
11
-
12
-
13
-
14
-
15
-
16
-
17
-
18
-
19
-
20
-
21
-
22
-
23
-
24
-
25
-
26
-
27
-
28
-
29
-
30
-
31
-
32
-
33
-
34
-
35
-
36
-
37
-
38
-
39
-
40
-
41
-
42
-
43
-
44
-
45
-
 46
46 -
 47
47 -
 48
48 -
 49
49 -
 50
50 -
 51
51 -
 52
52 -
 53
53 -
 54
54 -
 55
55 -
 56
56 -
 57
57 -
 58
58 -
 59
59 -
 60
60 -
 61
61 -
 62
62 -
 63
63 -
 64
64 -
 65
65 -
 66
66 -
67
-
68
-
69
-
70
-
71
-
72
-
73
-
74
-
75
-
76
-
77
-
78
-
79
-
80
-
81
-
82
-
83
-
84
-
85
-
86
-
87
-
88
-
89
-
90
-
91
-
92
-
93
-
94
-
95
-
96
-
97
-
98
-
99
-
100
-
101
-
102
 |
 |
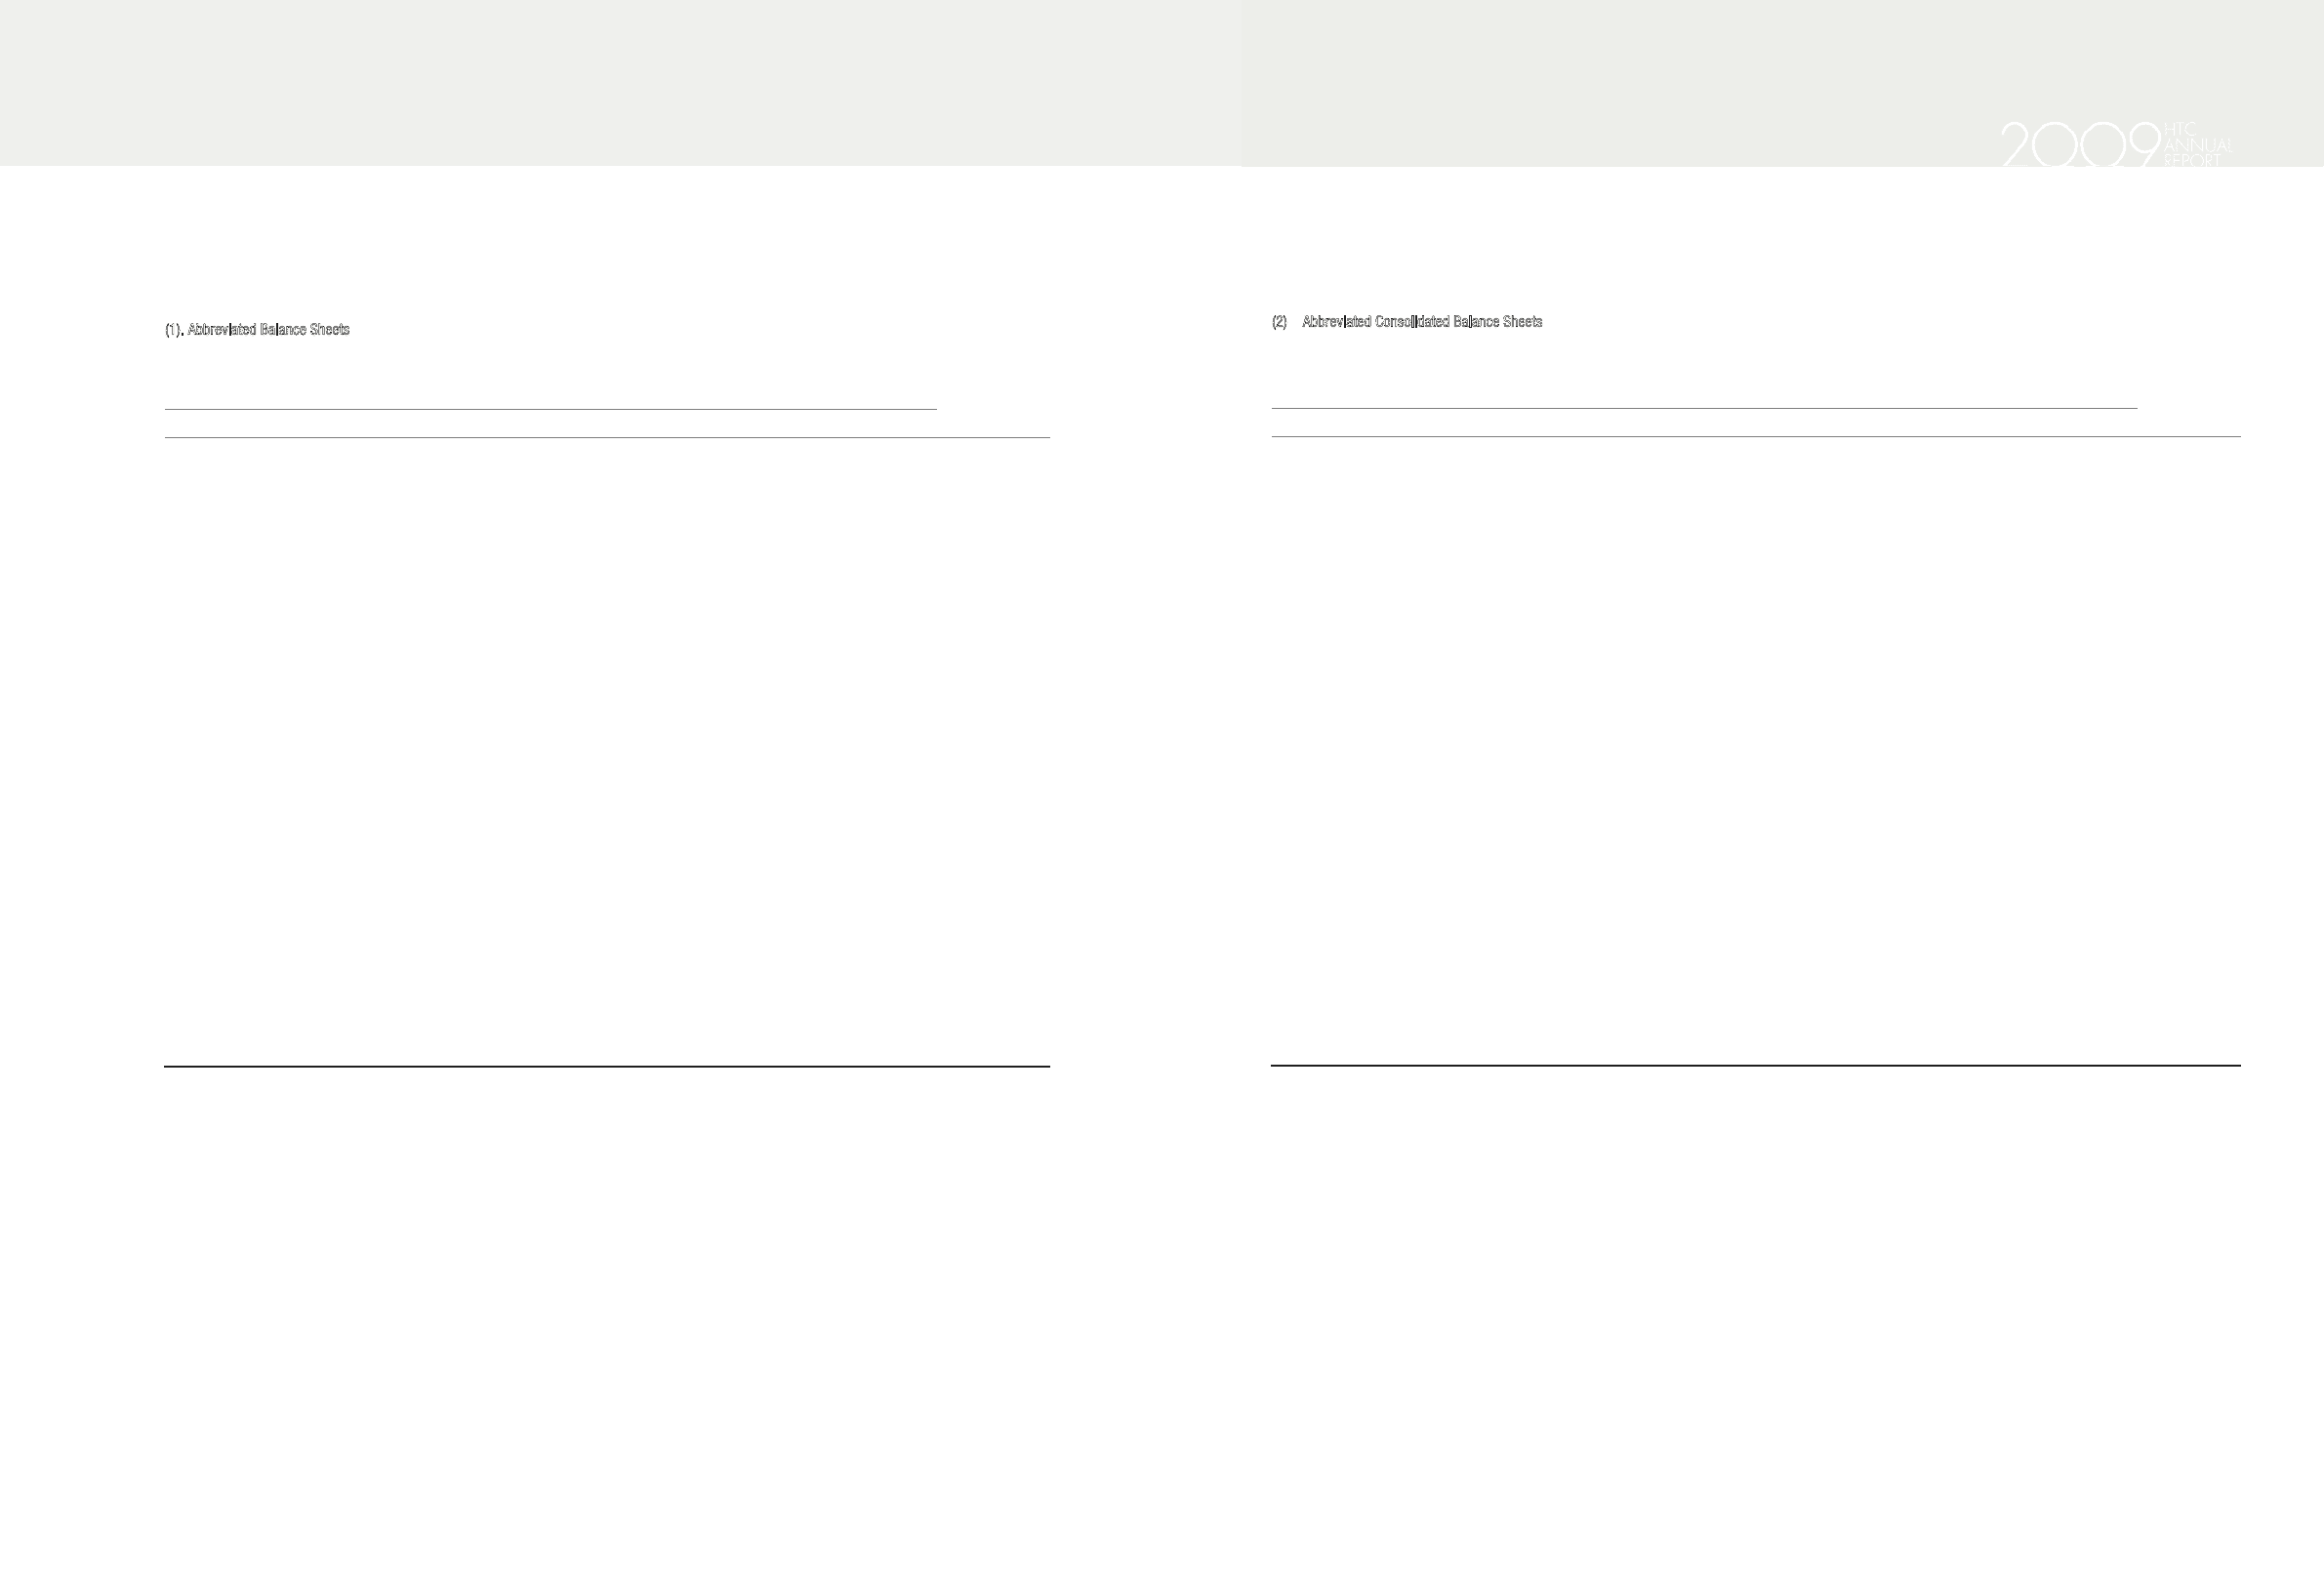
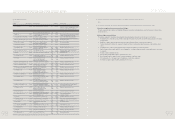
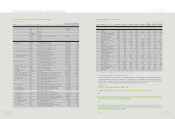
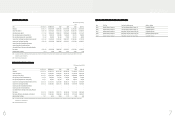
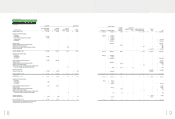
(2) Abbreviated Consolidated Balance Sheets
Unit烉NT$ thousands
Year As of
2010.3.31
Item
2009 2008 2007 2006 2005
Current Assets
104,422,387 104,256,700 85,763,011 62,812,623 37,037,068 111,379,936
Long-term Investments
810,485 541,437 501,976 2,925 2,028 565,105
Properties (note 1)
9,899,808 8,916,350 4,220,962 3,170,398 2,610,209 10,516,007
Intangible Assets
240482 289783 175206 - - 240,473
Other Assets
3,577,361 1,738,140 755,326 477,478 491,201 3,483,924
Total Assets
118,950,523 115,742,410 91,416,481 66,463,424 40,140,506 126,185,445
Current Liabilities Before Appropriation
53,250,281 54,998,933 35,152,925 23,757,897 17,154,404 60,369,937
After Appropriation
(Note 2) 75,124,567 55,849,472 37,443,367 22,603,628 (Note 2)
Long-term Liabilities
24,375 46,875 75,625 - - 20,313
Other Liabilities
1,210 6,420 633 640 561 1,572
Total Liabilities Before Appropriation
53,275,866 55,052,228 35,229,183 23,758,537 17,154,965 60,391,822
After Appropriation
(Note 2) 75,177,862 55,925,730 37,444,007 22,604,189 (Note 2)
Capital stock
7,889,358 7,553,938 5,731,337 4,364,192 3,570,160 7,889,358
Capital surplus
9,099,923 4,417,534 4,415,845 4,452,688 4,436,843 9,099,923
Retained Earnings Before Appropriation
48,637,773 52,036,321 45,920,120 33,988,785 14,984,714 53,636,200
After Appropriation
(Note 2) 31,537,990 23,400,972 18,899,930 8,741,458 (Note 2)
Unrealized Loss On Financial Instruments
( 1,658 ) ( 1,632 ) ( 1,187 ) ( 238 ) ( 1,135 ) ( 1,658)
Cumulative Translation Adjustments
15,088 65,602 9,664 10,786 ( 5,041 ) ( 23,456)
Net Loss Not Recognized As Pension Cost
(34) - - - - ( 34)
Treasury Stock
-( 3,410,277 ) - ( 243,995 ) - ( 4,834,174)
Minority Interest
34,207 28,696 111,519 132,669 - 27,464
Total Stockholders
Equity Before Appropriation
65,674,657 60,690,182 56,187,298 42,704,887 22,985,541 65,793,623
After Appropriation
(Note 2) 40,564,548 35,490,751 29,019,417 17,536,317 (Note 2)
Note 1: The relatively higher value of consolidated properties is due to the inclusion of the plants and facilities of HTC Electronics (Shanghai) Co., Ltd. and High Tech Computer Corp. (Suzhou), two HTC subsidiaries engaged
in the production of smart phones and related components.
Note 2: Subject to change after shareholders’ meeting resolution
)LQDQFLDO,QIRUPDWLRQ
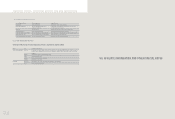
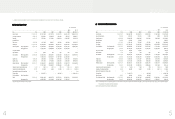
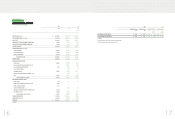
1. ABBREVIATED BALANCE SHEETS AND INCOME STATEMENTS FOR THE PAST FIVE FISCAL YEARS
(1). Abbreviated Balance Sheets
Unit烉NT$ thousands
Year As of
2010.3.31
Item
2009 2008 2007 2006 2005
Current Assets
101,025,179 101,271,990 83,172,719 61,810,772 36,616,174 106,651,678
Long-term Investments
6,506,194 5,160,891 2,899,109 824,481 325,533 6,966,017
Properties
8,314,177 7,375,651 3,715,901 2,909,624 2,495,256 8,928,270
Intangible Assets
- - - - - -
Other Assets
3,297,898 1,417,830 656,817 449,300 484,309 3,204,573
Total Assets
119,143,448 115,226,362 90,444,546 65,994,177 39,921,272 125,750,538
Current Liabilities Before Appropriation
53,501,788 54,558,470 34,368,139 23,421,319 16,935,170 59,983,169
After Appropriation
* 74,684,104 55,064,686 37,106,789 22,384,394 *
Long-term Liabilities
- - - - - -
Other Liabilities
1,210 6,406 628 640 561 1,210
Total Liabilities Before Appropriation
53,502,998 54,564,876 34,368,767 23,421,959 16,935,731 59,984,379
After Appropriation
* 74,690,510 55,065,314 37,107,429 22,384,955 *
Capital stock
7,889,358 7,553,938 5,731,337 4,364,192 3,570,160 7,889,358
Capital surplus
9,099,923 4,417,534 4,415,845 4,452,688 4,436,843 9,099,923
Retained Earnings Before Appropriation
48,637,773 52,036,321 45,920,120 33,988,785 14,984,714 53,636,200
After Appropriation
* 31,537,990 23,400,972 18,899,930 8,741,458 *
Unrealized Loss On Financial Instruments
( 1,658 ) ( 1,632 ) ( 1,187 ) ( 238 ) ( 1,135 ) ( 1,658 )
Cumulative Translation Adjustments
15,088 65,602 9,664 10,786 ( 5,041 ) ( 23,456 )
Net Loss Not Recognized As Pension Cost
( 34 ) - - - - ( 34 )
Treasury Stock
- ( 3,410,277 ) - ( 243,995 ) - ( 4,834,174 )
Total Stockholders
Equity
Before Appropriation
65,640,450 60,661,486 56,075,779 42,572,218 22,985,541 65,766,159
After Appropriation
* 40,535,852 35,379,232 28,886,748 17,536,317 *
*Subject to change after shareholders’ meeting resolution
)LQDQFLDO,QIRUPDWLRQ