HTC 2009 Annual Report Download - page 78
Download and view the complete annual report
Please find page 78 of the 2009 HTC annual report below. You can navigate through the pages in the report by either clicking on the pages listed below, or by using the keyword search tool below to find specific information within the annual report.-
 1
1 -
2
-
3
-
4
-
5
-
6
-
7
-
8
-
9
-
10
-
11
-
12
-
13
-
14
-
15
-
16
-
17
-
18
-
19
-
20
-
21
-
22
-
23
-
24
-
25
-
26
-
27
-
28
-
29
-
30
-
31
-
32
-
33
-
34
-
35
-
36
-
37
-
38
-
39
-
40
-
41
-
42
-
43
-
44
-
45
-
46
-
47
-
48
-
49
-
50
-
51
-
52
-
53
-
54
-
55
-
56
-
57
-
58
-
59
-
60
-
61
-
62
-
63
-
64
-
65
-
66
-
67
-
 68
68 -
 69
69 -
 70
70 -
 71
71 -
 72
72 -
 73
73 -
 74
74 -
 75
75 -
 76
76 -
 77
77 -
 78
78 -
 79
79 -
 80
80 -
 81
81 -
 82
82 -
 83
83 -
 84
84 -
 85
85 -
 86
86 -
 87
87 -
 88
88 -
89
-
90
-
91
-
92
-
93
-
94
-
95
-
96
-
97
-
98
-
99
-
100
-
101
-
102
 |
 |
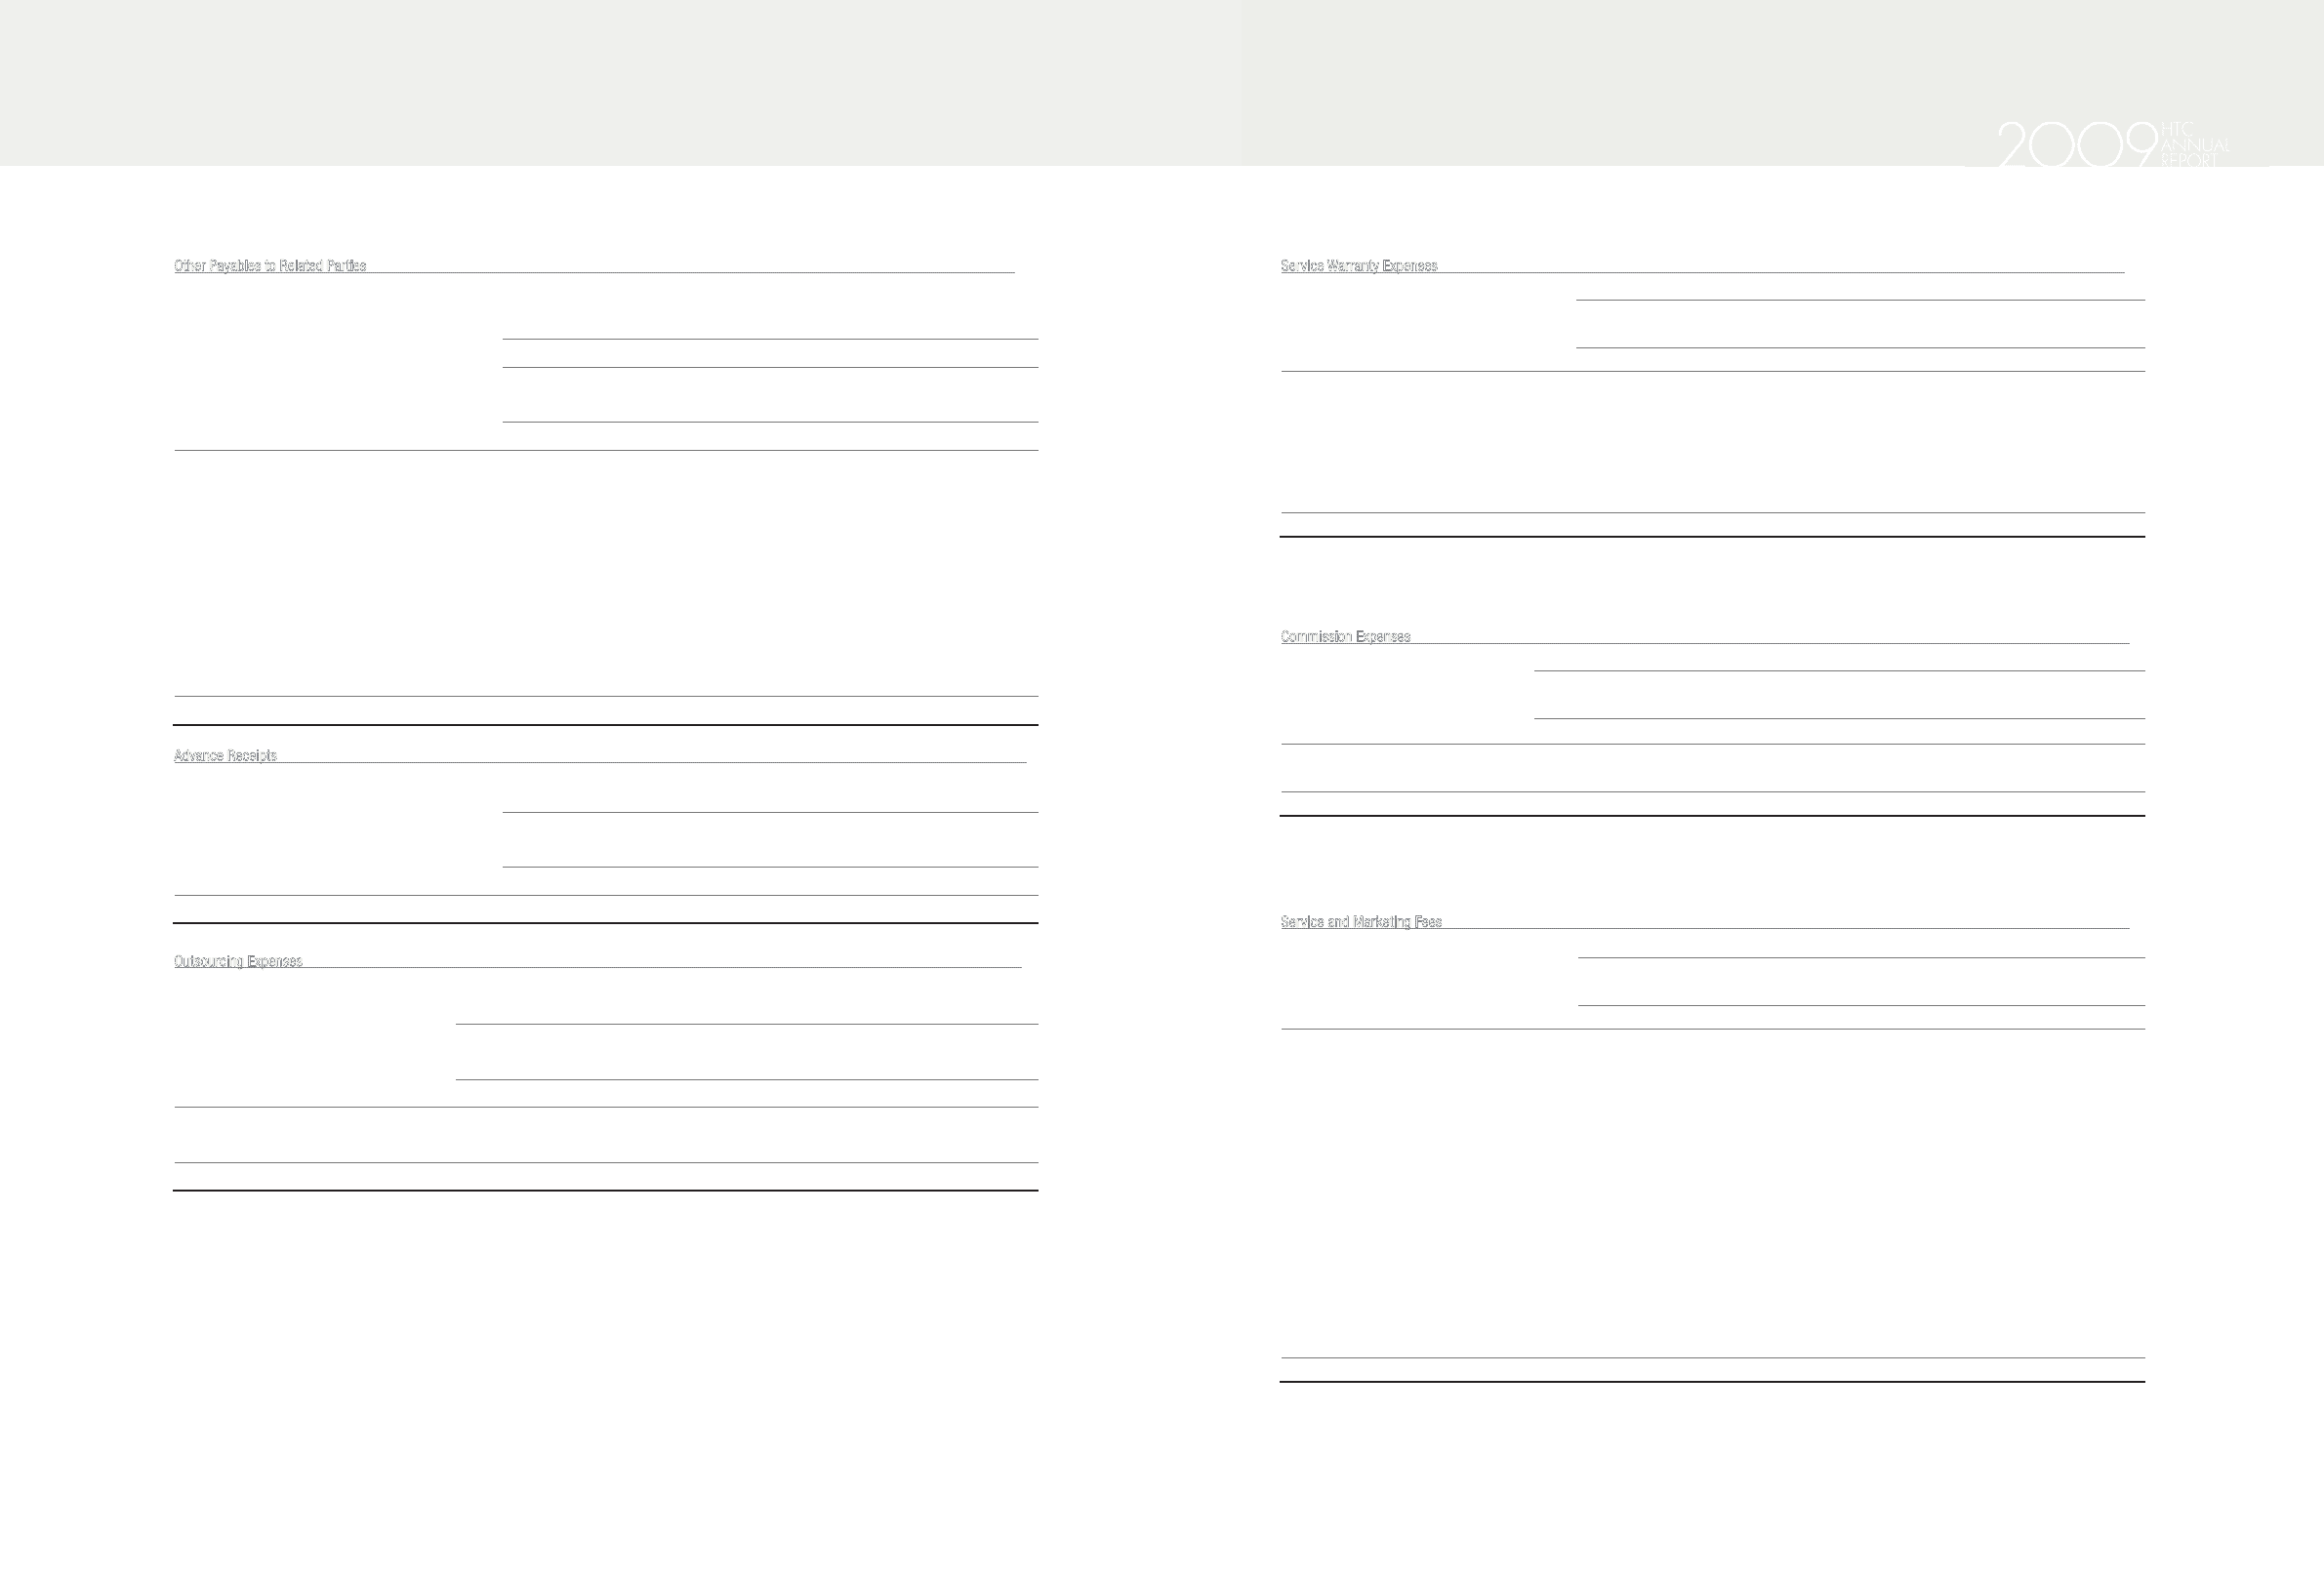
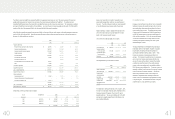
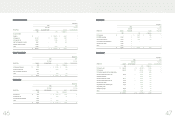
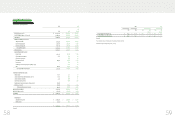
Service Warranty Expenses
2008 2009
Related Party Amount
% to Total
Warranty Expenses Amount
% to Total
Warranty Expenses
NT$ NT$ US$
HTC America Inc. $ 1,105,226 19 $ 1,211,149 $ 37,860 22
HTC Europe Co., Ltd. 564,780 10 319,210 9,979 6
HTC Corporation (Shanghai WGQ) 87,317 1 89,358 2,793 2
High Tech Computer (H.K.) Limited 29,738 - 48,179 1,506 1
High Tech Computer Singapore Pte. Ltd. 18,292 - 29,985 937 -
Comserve Network Netherlands B.V. 14,491 - 1,203 38 -
$ 1,819,844 30 $ 1,699,084 $ 53,113 31
Service warranty expense resulted from authorizing the above related parties to provide after-sales service.
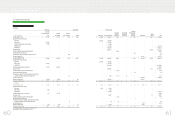
Commission Expenses
2008 2009
Related Party Amount
% to Total
Commission Expenses Amount
% to Total
Commission Expenses
NT$ NT$ US$(Note 3)
HTC Europe Co., Ltd. $ - - $ 2,547,351 $ 79,630 86
HTC Belgium BVBA/SPRL - - 424,299 13,263 14
$- -$ 2,971,650 $ 92,893 100
In 2009, the Company changed the calculation method on the basis of the nature of services rendered by the related parties.
Service and Marketing Fees
2008 2009
Related Party Amount
% to Total
Service Expenses Amount
% to Total
Service Expenses
NT$ NT$ US$(Note 3)
HTC America Inc. $ 1,846,017 27 $ 2,541,746 $ 79,454 33
HTC NIPPON Corporation 336,913 5 211,502 6,612 3
Communication Global Certification Inc. 139,200 2 175,930 5,500 2
HTC Brasil 219,394 3 173,325 5,418 2
High Tech Computer Singapore Pte. Ltd. 171,054 2 166,508 5,205 2
One & Company Design, Inc. 9,792 - 157,246 4,915 2
HTC Europe Co., Ltd. 2,030,696 29 142,260 4,447 2
HTC Belgium BVBA/SPRL 600,114 9 142,164 4,444 2
High Tech Computer (H.K.) Limited 94,322 1 94,256 2,946 1
HTC (Australia and New Zealand) Pty. Ltd. 111,902 2 92,283 2,885 1
HTC India Private Limited 118,461 2 63,051 1,971 1
HTC (Thailand) Limited 34,755 1 40,669 1,271 1
High Tech Computer Asia Pacific Pte. Ltd. 65,600 1 -- -
Others 4,650 - 46,273 1,447 1
$ 5,782,870 84 $ 4,047,213 $ 126,515 53
)LQDQFLDO,QIRUPDWLRQ
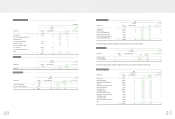
Other Payables to Related Parties
December 31
2008 2009
Related Party Amount
% to Total
Other Payables Amount
% to Total
Other Payables
NT$ NT$ US$(Note 3)
HTC America Inc. $ 210,389 33 $ 317,708 $ 9,931 35
High Tech Computer Asia Pacific Pte. Ltd. - - 96,438 3,015 11
HTC EUROPE CO, LTD. - - 83,509 2,610 9
HTC Corporation (Shanghai WGQ) 5,564 1 15,470 484 2
HTC Nippon Corporation 20,011 3 7,069 221 1
High Tech Computer (H.K.) Limited - - 6,776 212 1
H.T.C. (B.V.I.) Corp. 122,700 20 -- -
Communication Global Certification Inc. 14,972 2 -- -
Others 1,331 - 4,797 150 -
$ 374,967 59 $ 531,767 $ 16,623 59
Advance Receipts
2008 2009
Related Party Amount
% to Total
Advance Receipts Amount
% to Total
Advance Receipts
NT$ NT$ US$(Note 3)
BandRich Inc $ - - $ 61,358 $ 1,918 11
Outsourcing Expenses
2008 2009
Related Party Amount
% to Total
Outsourcing Expense Amount
% to Total
Outsourcing Expense
NT$ NT$ US$(Note 3)
HTC Electronics (Shanghai) $ 9,084 2 $ 306,410 $ 9,578 95
High Tech Computer Corp. (Suzhou) 281,470 58 3,775 118 1
$ 290,554 60 $ 310,185 $ 9,696 96
)LQDQFLDO,QIRUPDWLRQ