HTC 2009 Annual Report Download - page 62
Download and view the complete annual report
Please find page 62 of the 2009 HTC annual report below. You can navigate through the pages in the report by either clicking on the pages listed below, or by using the keyword search tool below to find specific information within the annual report.-
 1
1 -
2
-
3
-
4
-
5
-
6
-
7
-
8
-
9
-
10
-
11
-
12
-
13
-
14
-
15
-
16
-
17
-
18
-
19
-
20
-
21
-
22
-
23
-
24
-
25
-
26
-
27
-
28
-
29
-
30
-
31
-
32
-
33
-
34
-
35
-
36
-
37
-
38
-
39
-
40
-
41
-
42
-
43
-
44
-
45
-
46
-
47
-
48
-
49
-
50
-
51
-
 52
52 -
 53
53 -
 54
54 -
 55
55 -
 56
56 -
 57
57 -
 58
58 -
 59
59 -
 60
60 -
 61
61 -
 62
62 -
 63
63 -
 64
64 -
 65
65 -
 66
66 -
 67
67 -
 68
68 -
 69
69 -
 70
70 -
 71
71 -
 72
72 -
73
-
74
-
75
-
76
-
77
-
78
-
79
-
80
-
81
-
82
-
83
-
84
-
85
-
86
-
87
-
88
-
89
-
90
-
91
-
92
-
93
-
94
-
95
-
96
-
97
-
98
-
99
-
100
-
101
-
102
 |
 |

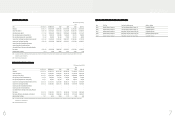
2008 2009
Before Income Tax After Income Tax Before Income Tax After Income Tax
NT$ NT$ NT$ US$
(Note 3)
NT$ US$
(Note 3)
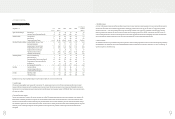
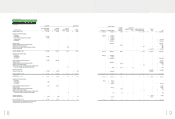
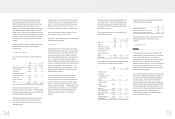
BASIC EARNINGS PER SHARE (Note 23) $ 39.89 $ 36.16 $ 32.02 $ 1.00 $ 28.71 $ 0.90
DILUTED EARNINGS PER SHARE (Note 23) $ 38.56 $ 34.95 $ 31.42 $ 0.98 $ 28.18 $ 0.88
(Concluded)
The accompanying notes are an integral part of the financial statements.
(With Deloitte & Touche audit report dated January 18, 2010)
)LQDQFLDO,QIRUPDWLRQ
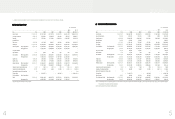
HTC CORPORATION
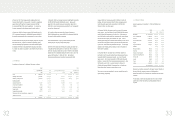
STATEMENTS OF INCOME
YEARS ENDED DECEMBER 31, 2008 AND 2009
(In Thousands, Except Earnings Per Share)
2008 2009
NT$ NT$ US$
(Note 3)
REVENUES (Notes 2 and 25) $ 152,558,766 $ 144,880,715 $ 4,528,938
COST OF REVENUES (Notes 4, 21 and 25) 101,916,912 99,018,232 3,095,287
GROSS PROFIT 50,641,854 45,862,483 1,433,651
UNREALIZED PROFIT FROM INTERCOMPANY TRANSACTIONS ( 134,091 ) ( 108,150 ) ( 3,381 )
REALIZED PROFIT FROM INTERCOMPANY TRANSACTIONS 175,075 134,091 4,192
REALIZED GROSS PROFIT 50,682,838 45,888,424 1,434,462
OPERATING EXPENSES (Notes 21 and 25)
Selling and marketing 9,009,785 11,103,061 347,079
General and administrative 1,798,900 2,010,000 62,832
Research and development 9,617,768 8,600,369 268,846
Total operating expenses 20,426,453 21,713,430 678,757
OPERATING INCOME 30,256,385 24,174,994 755,705
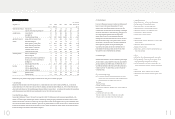
NONOPERATING INCOME AND GAINS
Interest income 1,368,322 348,693 10,900
Gains on equity-method investments (Notes 2 and 14) -273,811 8,559
Gains on disposal of properties (Note 25) 5,631 2,984 93
Gain on sale of investments -3,035 95
Exchange gains (Note 2) 660,765 513,650 16,057
Valuation gain on financial instruments, net (Notes 2 and 6) -18,132 567
Other 265,300 463,057 14,475
Total nonoperating income and gains 2,300,018 1,623,362 50,746
NONOPERATING EXPENSES AND LOSSES
Interest expense 232 131 4
Losses on equity-method investments (Notes 2 and 14) 57,289 --
Losses on disposal of properties 5,931 --
Impairment loss (Notes 2 and 14) -30,944 967
Valuation loss on financial instruments, net (Notes 2 and 6) 514,083 -
Other (Notes 17 and 25) 388,389 554,817 17,344
Total nonoperating expenses and losses 965,924 585,892 18,315
INCOME BEFORE INCOME TAX 31,590,479 25,212,464 788,136
INCOME TAX (Notes 2 and 22) ( 2,955,130 ) ( 2,603,562 ) ( 81,387 )
NET INCOME $ 28,635,349 $ 22,608,902 $ 706,749
(Continued)
)LQDQFLDO,QIRUPDWLRQ