HTC 2009 Annual Report Download - page 59
Download and view the complete annual report
Please find page 59 of the 2009 HTC annual report below. You can navigate through the pages in the report by either clicking on the pages listed below, or by using the keyword search tool below to find specific information within the annual report.-
 1
1 -
2
-
3
-
4
-
5
-
6
-
7
-
8
-
9
-
10
-
11
-
12
-
13
-
14
-
15
-
16
-
17
-
18
-
19
-
20
-
21
-
22
-
23
-
24
-
25
-
26
-
27
-
28
-
29
-
30
-
31
-
32
-
33
-
34
-
35
-
36
-
37
-
38
-
39
-
40
-
41
-
42
-
43
-
44
-
45
-
46
-
47
-
48
-
 49
49 -
 50
50 -
 51
51 -
 52
52 -
 53
53 -
 54
54 -
 55
55 -
 56
56 -
 57
57 -
 58
58 -
 59
59 -
 60
60 -
 61
61 -
 62
62 -
 63
63 -
 64
64 -
 65
65 -
 66
66 -
 67
67 -
 68
68 -
 69
69 -
70
-
71
-
72
-
73
-
74
-
75
-
76
-
77
-
78
-
79
-
80
-
81
-
82
-
83
-
84
-
85
-
86
-
87
-
88
-
89
-
90
-
91
-
92
-
93
-
94
-
95
-
96
-
97
-
98
-
99
-
100
-
101
-
102
 |
 |
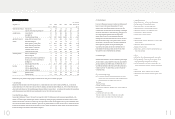
3. Profitability Analysis
In the face of difficult general economic conditions and different growth
tracks for various smart phone operating systems, HTC and its
subsidies revenue during 2009 represented a decrease from 2008.
Coupled with the aggressive brand promotion campaign run through the
year, the net income attribute to parent company for 2009 stood at 27%
less than that achieved during the previous year. ROA and ROE,
similarly, fell by 32% and 27%, respectively, below 2008 levels.
Operating income and income before taxes were 22% and 23% less in
2009, while the 2009 earnings per share (EPS) of NT$28.71 was also
less than 2008. Even so, HTC made in 2009 earnings valued at over
twice its registered capital and retained good profitability while
concurrently pressing ahead with research and development work,
brand visibility and awareness promotion and other efforts aimed at
enhancing HTC’s future competitiveness and profitability.
4. Cash Flow Analysis
The NT$5.9 billion reduction in net profit sustained during 2009 coupled
with an increase in royalty prepayments to reduce net cash provided by
operating activities by some NT$9.9 billion. The NT$60 million more in
cash dividends distributed in 2009 than in 2008 further contributed to a
reduction of 52% and 11%, respectively, in cash flow and cash flow
reinvestment ratios.
Note 1: Included employee bonus expenses
Note 2: In accordance with 2008 and 2009 financial reporting requirements, write-downs of
inventories or reversal of write-downs and product warranty costs registered during the
period 2005 to 2007 have been reclassified as cost of revenues items.
Note 3: Glossary
a. Capital Structure Analysis
(1) Debt Ratio烌Total Liabilities / Total Assets.
(2) Long-term Fund to Fixed Assets Ratio烌(Shareholders' Equity + Long-term Liabilities) / Net
Fixed Assets.
b. Liquidity Analysis
(1) Current Ratio烌Current Assets / Current Liabilities.
(2) Quick Ratio烌(Current Assets - Inventories - Prepaid Expenses) / Current Liabilities.
(3) Times Interest Earned烌Earnings before Interest and Taxes / Interest Expenses.
c. Operating Performance Analysis
(1) Average Collection Turnover烌 Net Sales / Average Trade Receivables.
(2) Days Sales Outstanding烌365 / Average Collection Turnover.
(3) Average Inventory Turnover烌Cost of Sales / Average Inventory.
(4) Average Payment Turnover烌Cost of Sales / Average Trade Payables.
(5) Average Inventory Turnover Days烌365 / Average Inventory Turnover.
(6) Fixed Assets Turnover烌Net Sales / Net Fixed Assets.
(7) Total Assets Turnover烌Net Sales / Total Assets.
d. Profitability Analysis
(1) Return on Total Assets烌(Net Income + Interest Expenses * (1 - Effective Tax Rate) )
/ Average Total Assets.
(2) Return on Equity烌Net Income / Average Shareholders' Equity.
(3) Net Margin烌Net Income / Net Sales.
(4) Earnings Per Share烌(Net Income - Preferred Stock Dividend) / Weighted Average
Number of Shares Outstanding.
e. Cash Flow
(1) Cash Flow Ratio烌Net Cash Provided by Operating Activities / Current Liabilities.
(2) Cash Flow Adequacy Ratio烌Five-year Sum of Cash from Operations / Five-year
Sum of Capital Expenditures, Inventory Additions, and Cash Dividend.
(3) Cash Flow Reinvestment Ratio烌(Cash Provided by Operating Activities - Cash
Dividends) / (Gross Fixed Assets + Investments + Other Assets + Working Capital).
f. Leverage
(1) Operating Leverage烌(Net Sales - Variable Cost) / Income from Operations.
(2) Financial Leverage烌Income from Operations / (Income from Operations – Interest
Expenses)
)LQDQFLDO,QIRUPDWLRQ
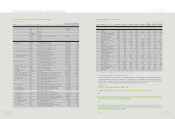
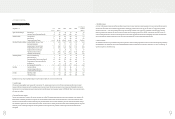
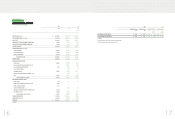
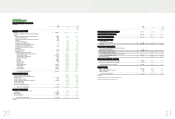
(2) Financial Analysis (Consolidated)
Unit烉NT$ thousands
Item (Note 2~3炸2009
(Note 1)
2008
(Note 1)
2007 2006 2005 2010 1Q (N
ote 1)
Capital Structure Analysis Debt Ratio (%) 45 48 39 36 43 48
Long-term Fund to Fixed Assets Ratio (%) 664 681 1,333 1,347 881 626
Liquidity Analysis Current Ratio (%) 196 190 244 264 216 184
Quick Ratio (%) 178 171 217 230 181 164
Times Interest Earned (Times) 11,683 3,041 26,595 90,413 614 11,077
Operating Performance
Analysis
Average Collection Turnover (Times) 4.97 6.12 6.06 6.25 6.35 5.43
Days Sales Outstanding 73 60 60 58 57 67
Average Inventory Turnover (Times) 10.37 10.95 9.68 11.34 10.61 10.45
Average Payment Turnover (Times) 3.66 3.92 3.66 4.65 5.07 4.03
Average Inventory Turnover Days 35 33 38 32 34 35
Fixed Assets Turnover (Times) 14.60 17.09 28.01 33.23 28.02 14.43
Total Assets Turnover (Times) 1.21 1.32 1.29 1.59 1.82 1.20
Profitability Analysis Return on Total Assets (%) 19 28 37 47 38 16
Return on Equity (%) 36 49 58 77 69 30
Operating Income to Paid-in Capital Ratio (%) 312 402 535 590 342 72
Pre-tax Income to Paid-in Capital Ratio (%) 322 420 562 617 341 73
Net Margin (%) 16 19 24 24 16 13
Basic Earnings Per Share (NT$) 28.71 36.16 36.48 31.57 14.85 6.38
Cash Flow Cash Flow Ratio (%) 52 68 113 104 74 17
Cash Flow Adequacy Ratio (%) 197 218 283 287 194 266
Cash Flow Reinvestment Ratio (%) 11 28 47 43 45 14
Leverage Operating Leverage 1.66 1.44 1.20 1.16 1.26 1.73
Financial Leverage 1.00 1.00 1.00 1.00 1.00 1.00
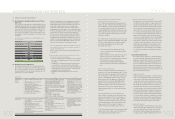
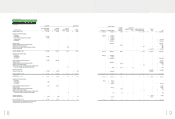
Explanations of primary reasons underlying changes in key financial ratios during the most recent two-year period:
1. Liquidity Analysis
Consolidated interest expenses during 2009 arose primarily from a credit-based loan taken out by HTC subsidiary, BandRich, Inc., to streamline its
working capital turnover and a medium-term loan secured by HTC subsidiary, Communication Global Certification Inc., from the Taiwan Business Bank
with an industry R&D scheme from the Industrial Development Bureau, Ministry of Economic Affairs. Lower interest rates resulted in the comparatively
smaller interest expenses during 2009 and the corresponding 284% rise over 2008 in the times interest earned.
2. Operating Performance Analysis
The days sales outstanding of 73 days in 2009 was 13 days longer than in 2008. This relatively longer collection period is largely attributable to the
increase in HTC brand business, necessitating the collection of payments from telecommunication service providers and channel customers in various
locations around the world. Furthermore, the financial crisis that made its effects fully felt by 4Q 2008 raised the value of accounts receivables by year’s
end, which also increased the average trade receivables. Together with the reduced revenues seen in 2009, this had the effect of reducing the collection
turnover times and extending further the days sales outstanding. In terms of inventory management, the average inventory turnover days held steady at
35 days; underscoring the effectiveness of HTC inventory management.
)LQDQFLDO,QIRUPDWLRQ