HTC 2009 Annual Report Download - page 85
Download and view the complete annual report
Please find page 85 of the 2009 HTC annual report below. You can navigate through the pages in the report by either clicking on the pages listed below, or by using the keyword search tool below to find specific information within the annual report.-
 1
1 -
2
-
3
-
4
-
5
-
6
-
7
-
8
-
9
-
10
-
11
-
12
-
13
-
14
-
15
-
16
-
17
-
18
-
19
-
20
-
21
-
22
-
23
-
24
-
25
-
26
-
27
-
28
-
29
-
30
-
31
-
32
-
33
-
34
-
35
-
36
-
37
-
38
-
39
-
40
-
41
-
42
-
43
-
44
-
45
-
46
-
47
-
48
-
49
-
50
-
51
-
52
-
53
-
54
-
55
-
56
-
57
-
58
-
59
-
60
-
61
-
62
-
63
-
64
-
65
-
66
-
67
-
68
-
69
-
70
-
71
-
72
-
73
-
74
-
 75
75 -
 76
76 -
 77
77 -
 78
78 -
 79
79 -
 80
80 -
 81
81 -
 82
82 -
 83
83 -
 84
84 -
 85
85 -
 86
86 -
 87
87 -
 88
88 -
 89
89 -
 90
90 -
 91
91 -
 92
92 -
 93
93 -
 94
94 -
 95
95 -
96
-
97
-
98
-
99
-
100
-
101
-
102
 |
 |
2008 2009
NT$ NT$ US$
(Note 3)
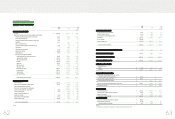
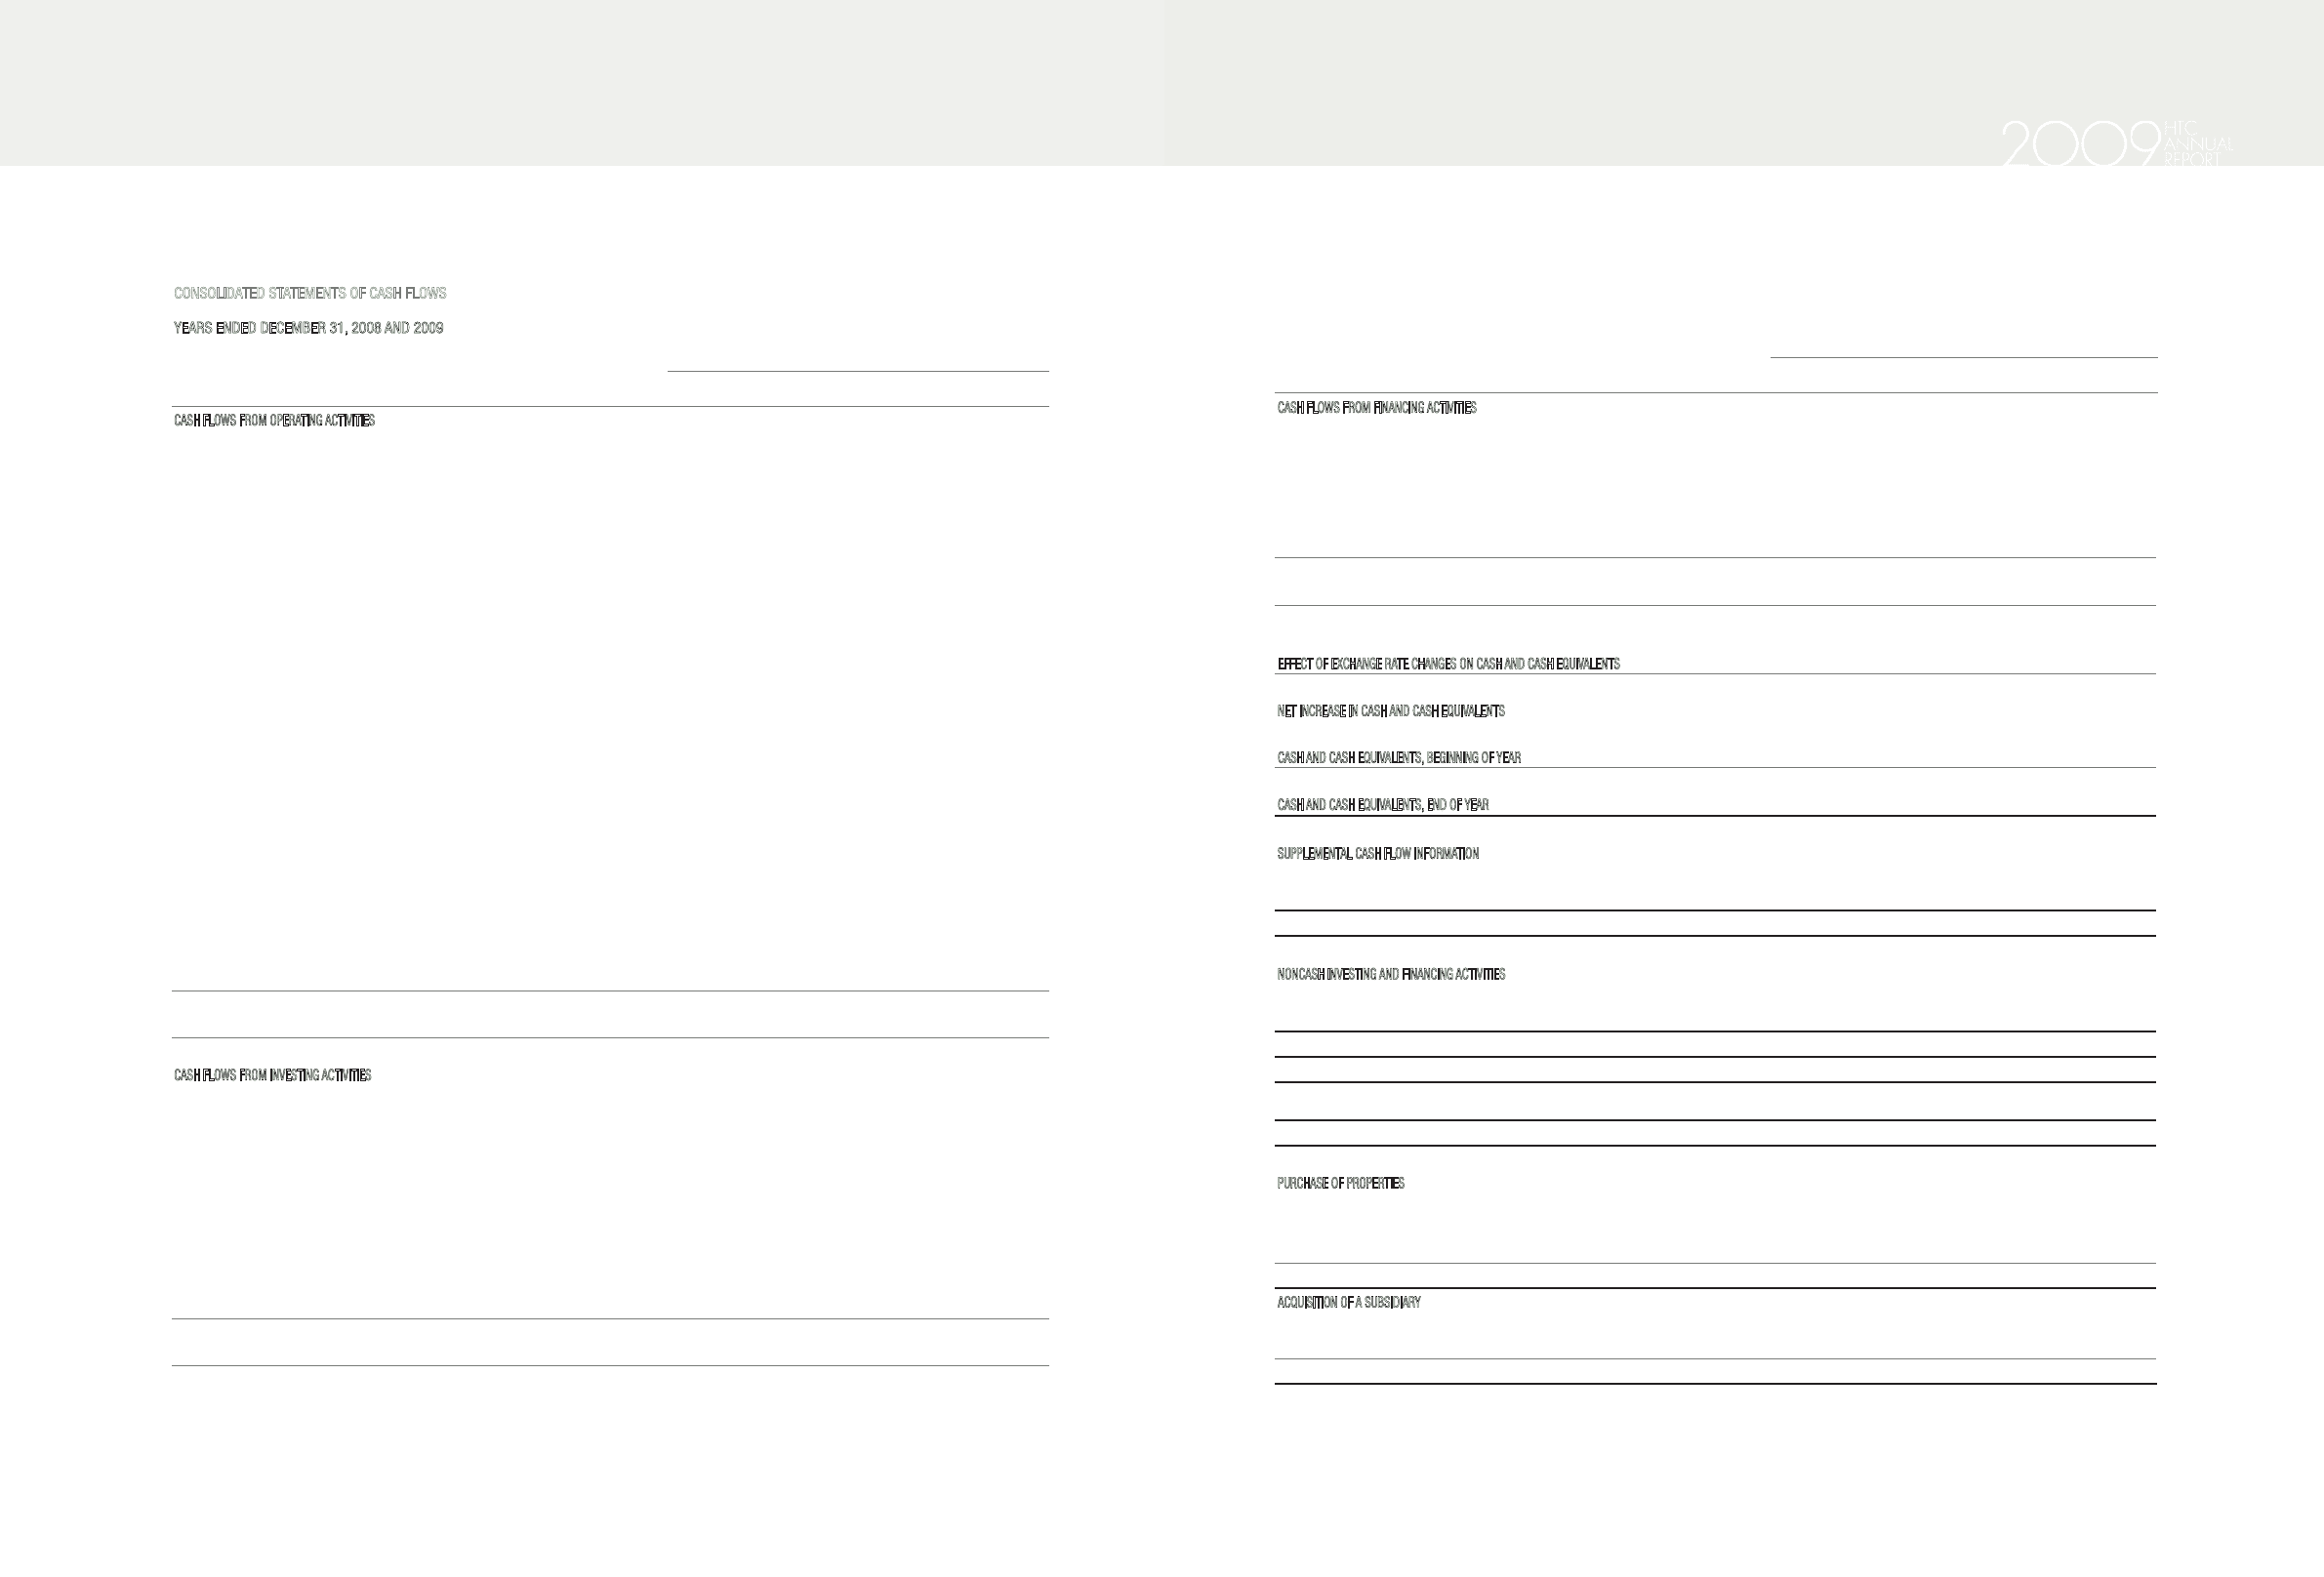
CASH FLOWS FROM FINANCING ACTIVITIES
Increase (decrease) in short-term borrowings 75,000 (2,674 ) (84 )
Decrease in long-term bank loans ( 20,625 )(28,750 ) (899 )
Increase (decrease) in guarantee deposits received 5,787 (5,210 ) (162 )
Cash dividends ( 19,486,547 )(20,125,634 ) (629,123 )
Bonus to employees ( 1,210,000 )--
Purchase of treasury stock ( 3,410,277 )(2,406,930 ) (75,240 )
Net cash used in financing activities ( 24,046,662 )(22,569,198 ) (705,508 )
EFFECT OF EXCHANGE RATE CHANGES ON CASH AND CASH EQUIVALENTS
( 18,743 )(8,808 ) (276 )
NET INCREASE IN CASH AND CASH EQUIVALENTS
7,747,543 400,562 12,521
CASH AND CASH EQUIVALENTS, BEGINNING OF YEAR
56,490,185 64,237,728 2,008,057
CASH AND CASH EQUIVALENTS, END OF YEAR
$64,237,728 $64,638,290 $2,020,578
SUPPLEMENTAL CASH FLOW INFORMATION
Cash paid during the year
Interest $10,354 $2,219 $69
Income tax $2,111,548 $3,057,172 $95,566
NONCASH INVESTING AND FINANCING ACTIVITIES
Transfer of bond investment not quoted in an active market to
investments accounted for by the equity method $33,030 $ - $-
Transfer of properties to assets leased to others $309,959 $ - $-
Transfer of assets leased to others to properties $-$261,824 $8,185
Transfer of retained earnings and employee bonuses to common stock $1,822,601 $5,327,586 $166,538
Retirement of treasury stock $ - $5,817,207 $181,844
PURCHASE OF PROPERTIES
Cost of properties purchased $5,773,031 $ 1,749,140 $ 54,678
Decrease (increase) in payable for purchase of equipment ( 134,806 )160,535 5,018
Decrease in lease payable 938 1,004 31
Cash paid for purchase of properties $5,639,163 $ 1,910,679 $ 59,727
ACQUISITION OF A SUBSIDIARY
Expected net cash outflow on the acquisition of a subsidiary $128,997 $ -$ -
Increase (decrease) in other payable ( 122,700 ) 26,262 821
Cash paid for acquisition of a subsidiary $6,297 $ 26,262 $821
(Concluded)
The accompanying notes are an integral part of the financial statements. (With Deloitte & Touche audit report dated January 18, 2010)
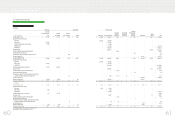
)LQDQFLDO,QIRUPDWLRQ
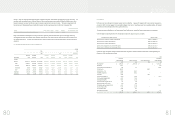
HTC CORPORATION AND SUBSIDIARIES
CONSOLIDATED STATEMENTS OF CASH FLOWS
YEARS ENDED DECEMBER 31, 2008 AND 2009
(In Thousands)
2008 2009
NT$ NT$ US$
(Note 3)
CASH FLOWS FROM OPERATING ACTIVITIES
Net income $ 28,552,526 $ 22,614,413 $ 706,922
Adjustments to reconcile net income to net cash provided by operating activities
Depreciation (including depreciation of assets leased to others) 746,472 901,848 28,192
Transfer of properties to expenses 18,103 7,474 234
Exchange loss on bond investments not quoted in an active market 2,670 --
Amortization 61,777 72,614 2,270
Gain on sale of investments, net - ( 3,035 )( 95 )
Loss (gain) on disposal of properties and deferred charges, net 2,857 ( 408 )( 12 )
Impairment loss - 78,946 2,467
Loss on equity-method investments 6,151 3,891 122
Deferred income tax assets ( 409,268 ) ( 506,522 )(
15,834 )
Prepaid pension cost ( 22,677 ) ( 20,525 )( 642 )
Net changes in operating assets and liabilities
Financial instruments at fair value through profit or loss 418,356 ( 532,215 )(
16,637 )
Notes and accounts receivable ( 9,970,016 ) 2,329,169 72,808
Other current financial assets ( 140,196 ) 58,050 1,815
Inventories ( 1,013,635 ) 2,692,624 84,171
Prepayments 282,622 ( 2,038,073 )(
63,710 )
Other current assets 17,947 ( 11,552 )( 361 )
Other assets – other - ( 1,843,170 )(
57,617 )
Notes and accounts payable 5,366,753 ( 3,417,414 )(
106,828 )
Income tax payable 1,469,214 231,349 7,232
Accrued expenses 10,221,198 6,570,007 205,377
Other current liabilities 2,016,103 533,103 16,665
Net cash provided by operating activities 37,626,957 27,720,574 866,539
CASH FLOWS FROM INVESTING ACTIVITIES
Purchase of properties ( 5,639,163 ) ( 1,910,679 )(
59,727 )
Proceeds of the sale of properties and deferred charges 76,857 70,682 2,209
Purchase of available-for-sale financial assets - ( 8,105,512 )(
253,376 )
Proceeds of the sale of available-for-sale financial assets - 5,611,153 175,403
Increase in long-term investments - equity method ( 10,626 ) ( 245,000 )(
7,659 )
Increase in restricted assets ( 6,965 )
( 64,787 )(
2,025 )
Increase in financial assets carried at cost - ( 64,330 )(
2,011 )
Acquisition of a subsidiary ( 6,297 )
( 26,262 )( 821 )
(Increase) decrease in refundable deposits ( 59,949 ) 62,828 1,964
Increase in deferred charges ( 167,866 ) ( 70,099 ) ( 2,191 )
Net cash used in investing activities ( 5,814,009 ) ( 4,742,006 ) ( 148,234 )
(Continued)
)LQDQFLDO,QIRUPDWLRQ