HTC 2009 Annual Report Download - page 58
Download and view the complete annual report
Please find page 58 of the 2009 HTC annual report below. You can navigate through the pages in the report by either clicking on the pages listed below, or by using the keyword search tool below to find specific information within the annual report.-
 1
1 -
2
-
3
-
4
-
5
-
6
-
7
-
8
-
9
-
10
-
11
-
12
-
13
-
14
-
15
-
16
-
17
-
18
-
19
-
20
-
21
-
22
-
23
-
24
-
25
-
26
-
27
-
28
-
29
-
30
-
31
-
32
-
33
-
34
-
35
-
36
-
37
-
38
-
39
-
40
-
41
-
42
-
43
-
44
-
45
-
46
-
47
-
 48
48 -
 49
49 -
 50
50 -
 51
51 -
 52
52 -
 53
53 -
 54
54 -
 55
55 -
 56
56 -
 57
57 -
 58
58 -
 59
59 -
 60
60 -
 61
61 -
 62
62 -
 63
63 -
 64
64 -
 65
65 -
 66
66 -
 67
67 -
 68
68 -
69
-
70
-
71
-
72
-
73
-
74
-
75
-
76
-
77
-
78
-
79
-
80
-
81
-
82
-
83
-
84
-
85
-
86
-
87
-
88
-
89
-
90
-
91
-
92
-
93
-
94
-
95
-
96
-
97
-
98
-
99
-
100
-
101
-
102
 |
 |

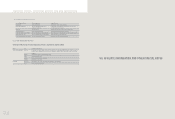
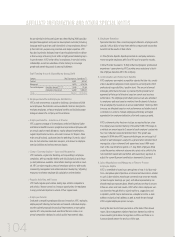
3. Profitability Analysis
In the face of difficult general economic conditions and different growth tracks for various smart phone operating systems, HTC revenue during 2009 represented a
decrease from 2008. Coupled with the aggressive brand promotion campaign run through the year, the net profit for 2009 stood at 27% less than that achieved
during the previous year. Return on total assets (ROA) and return on equity (ROE), similarly, fell by 31% and 27%, respectively, below 2008 levels. Operating
income and income before taxes were 24% and 23% less in 2009, while the 2009 earnings per share (EPS) of NT$28.71 was also less than 2008. Even so, HTC
made in 2009 earnings valued at over twice its registered capital and retained good profitability while concurrently pressing ahead with research and development
work, brand visibility and awareness promotion and other efforts aimed at enhancing HTC’s future competitiveness and profitability.
4. Cash Flow Analysis
The NT$6 billion reduction in net profit sustained during 2009 coupled with an increase in royalty prepayments to reduce net cash provided by operating activities by
some NT$10 billion. The NT$60 million more in cash dividends distributed in 2009 than in 2008 further contributed to a reduction of 51% and 11%, respectively, in
cash flow and cash flow reinvestment ratios.
)LQDQFLDO,QIRUPDWLRQ
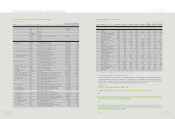
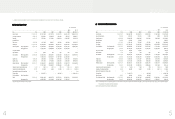
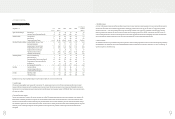
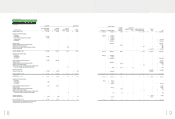
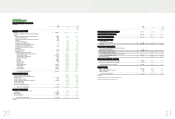
2. FINANCIAL ANALYSIS
(1) Financial Analysis (Unconsolidated)
Unit烉NT$ thousands
Item (Note 2~3炸2009
(Note 1)
2008
(Note 1)
2007 2006 2005 2010 1Q
(Note 1)
Capital Structure Analysis Debt Ratio (%) 45 47 38 35 42 48
Long-term Fund to Fixed Assets Ratio (%) 790 822 1,509 1,463 921 737
Liquidity Analysis Current Ratio (%) 189 186 242 264 216 178
Quick Ratio (%) 172 169 218 233 183 159
Times Interest Earned (Times) 192,463 136,167 133,409 90,464 614 336,504
Operating Performance Analysis Average Collection Turnover (Times) 4.92 6.09 6.01 6.09 6.25 5.33
Days Sales Outstanding 74 60 61 60 58 68
Average Inventory Turnover (Times) 11.71 12.68 12.14 13.01 11.38 11.65
Average Payment Turnover (Times) 3.75 4.08 4.03 4.80 5.22 4.09
Average Inventory Turnover Days 31 29 30 28 32 31
Fixed Assets Turnover (Times) 17.43 20.68 31.91 36.02 29.16 16.89
Total Assets Turnover (Times) 1.22 1.32 1.31 1.59 1.82 1.20
Profitability Analysis Return on Total Assets (%) 19 28 37 48 38 16
Return on Equity (%) 36 49 59 77 69 30
Operating Income to Paid-in Capital Ratio (%) 306 401 533 592 343 70
Pre-tax Income to Paid-in Capital Ratio (%) 320 418 561 618 340 73
Net Margin (%) 16 19 24 24 16 13
Basic Earnings Per Share (NT$) 28.71 36.16 36.48 31.57 14.85 6.38
Cash Flow Cash Flow Ratio (%) 51 69 116 106 75 17
Cash Flow Adequacy Ratio (%) 201 221 291 296 196 273
Cash Flow Reinvestment Ratio (%) 11 28 47 44 44 14
Leverage Operating Leverage 1.66 1.44 1.20 1.16 1.26 1.73
Financial Leverage 1.00 1.00 1.00 1.00 1.00 1.00
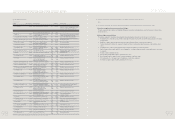
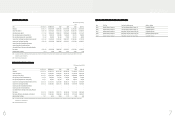
Explanations of primary reasons underlying changes in key financial ratios during the most recent two-year period:
1. Liquidity Analysis
HTC at present enjoys significant cash reserves with no external debt. The interest payment line item on the HTC income statement primarily relates to interest
expenses attributable to imputed interest from operating leases and security deposits. Interest expenses have thus been relatively small historically. Reductions in
imputed interest from operating lease and security deposit activity during 2009 caused interest expenses decrease to NT$130,000. Thus, the times interest earned is
41% higher than in 2008.
2. Operating Performance Analysis
The days sales outstanding of 74 days in 2009 was 14 days longer than in 2008. This relatively longer collection period is largely attributable to the increase in HTC
brand business, necessitating the collection of payments from telecommunication service providers and channel customers in various locations around the world.
Furthermore, the financial crisis that made its effects fully felt by 4Q 2008 raised the value of accounts receivables by year’s end, which also increased the average
trade receivables. Together with the reduced revenues seen in 2009, this had the effect of reducing the collection turnover times and extending further the days sales
outstanding. In terms of inventory management, the average inventory turnover days held steady at 30 days; underscoring the effectiveness of HTC inventory
management.
)LQDQFLDO,QIRUPDWLRQ