HTC 2009 Annual Report Download - page 61
Download and view the complete annual report
Please find page 61 of the 2009 HTC annual report below. You can navigate through the pages in the report by either clicking on the pages listed below, or by using the keyword search tool below to find specific information within the annual report.-
 1
1 -
2
-
3
-
4
-
5
-
6
-
7
-
8
-
9
-
10
-
11
-
12
-
13
-
14
-
15
-
16
-
17
-
18
-
19
-
20
-
21
-
22
-
23
-
24
-
25
-
26
-
27
-
28
-
29
-
30
-
31
-
32
-
33
-
34
-
35
-
36
-
37
-
38
-
39
-
40
-
41
-
42
-
43
-
44
-
45
-
46
-
47
-
48
-
49
-
50
-
 51
51 -
 52
52 -
 53
53 -
 54
54 -
 55
55 -
 56
56 -
 57
57 -
 58
58 -
 59
59 -
 60
60 -
 61
61 -
 62
62 -
 63
63 -
 64
64 -
 65
65 -
 66
66 -
 67
67 -
 68
68 -
 69
69 -
 70
70 -
 71
71 -
72
-
73
-
74
-
75
-
76
-
77
-
78
-
79
-
80
-
81
-
82
-
83
-
84
-
85
-
86
-
87
-
88
-
89
-
90
-
91
-
92
-
93
-
94
-
95
-
96
-
97
-
98
-
99
-
100
-
101
-
102
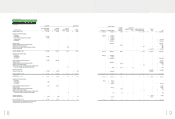
 |
 |

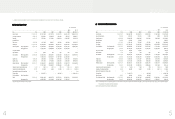
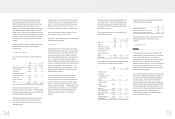
2008 2009
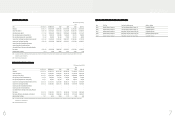
LIABILITIES AND STOCKHOLDERS
EQUITY NT$ NT$ US$
(Note 3)
CURRENT LIABILITIES
Financial liabilities at fair value through profit or
ġ
loss (Notes 2, 6 and 24) $ 514,083 $ -$-
Notes and accounts payable (Note 25) 27,907,144 24,882,322 777,816
Income tax payable (Notes 2 and 22) 3,937,745 4,152,624 129,810
Accrued expenses (Notes 4, 16 and 25) 15,632,936 17,127,974 535,417
Payable for purchase of equipment 157,786 68,906 2,154
Other current liabilities (Notes 2, 17 and 25) 6,408,776 7,269,962 227,257
Total current liabilities 54,558,470 53,501,788 1,672,454
OTHER LIABILITIES
Guarantee deposits received 6,406 1,210 38
Total liabilities 54,564,876 53,502,998 1,672,492
STOCKHOLDERS
EQUITY
(Note 19)
Capital stock
Common stock at par value of NT$10.00; authorized: 1,000,000
ġ
thousand shares; issued and outstanding: 755,394 thousand
ġ
shares in 2008 and 788,936 thousand shares in 2009 7,553,938 7,889,358 246,620
Capital surplus
Additional paid-in capital from share issuance in excess of par 4,374,244 9,056,323 283,099
Long-term equity investments 17,534 18,411 576
Merger 25,756 25,189 787
Retained earnings
Legal reserve 7,410,139 10,273,674 321,152
Accumulated earnings 44,626,182 38,364,099 1,199,253
Cumulative translation adjustments (Note 2) 65,602 15,088 471
Net loss not recognized as pension cost - (34)(1)
Unrealized valuation losses on financial instruments ( 1,632 ) ( 1,658 ) ( 52 )
ġ
(Notes 2 and 7)
Treasury stock (Notes 2 and 20) ( 3,410,277 ) --
Total stockholders
equity 60,661,486 65,640,450 2,051,905
TOTAL $ 115,226,362 $ 119,143,448 $ 3,724,397
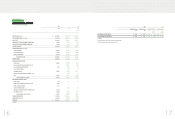
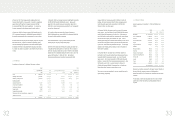
)LQDQFLDO,QIRUPDWLRQ
HTC CORPORATION
BALANCE SHEETS
DECEMBER 31, 2008 and 2009
(In Thousands, Except Par Value)
2008 2009
ASSETS NT$ NT$ US$
(Note 3)
CURRENT ASSETS
Cash and cash equivalents (Notes 2 and 5) $ 61,826,873 $ 61,676,464 $ 1,927,992
Financial assets at fair value through profit or loss (Notes 2, 6 and 24) - 18,132 567
Available-for-sale financial assets - current (Notes 2 and 7) - 2,497,394 78,068
Notes and accounts receivable, net (Notes 2 and 8) 28,860,242 25,326,228 791,692
Accounts receivable from related parties, net (Notes 2 and 25) 938,770 2,244,550 70,164
Other current financial assets (Notes 9 and 25) 275,506 234,201 7,321
Inventories (Notes 2, 4 and 10) 7,418,467 4,738,699 148,131
Prepayments (Notes 11 and 25) 1,237,631 3,351,491 104,767
Deferred income tax assets (Notes 2 and 22) 552,494 811,240 25,359
Other current assets 162,007 126,780 3,963
Total current assets 101,271,990 101,025,179 3,158,024
LONG-TERM INVESTMENTS
Available-for-sale financial assets - noncurrent (Notes 2 and 7) 339 313 10
Financial assets carried at cost (Notes 2 and 12) 501,192 501,192 15,667
Investments accounted for by the equity method (Notes 2 and 14) 4,342,704 5,549,766 173,484
Prepayments for long-term investments (Notes 2 and 14) 316,656 454,923 14,221
Total long-term investments 5,160,891 6,506,194 203,382
PROPERTIES
(Notes 2, 15 and 25)
Cost
Land 3,568,124 4,719,538 147,532
Buildings and structures 2,853,645 3,174,986 99,249
Machinery and equipment 3,927,100 4,003,941 125,162
Molding equipment 172,632 172,632 5,397
Computer equipment 264,248 302,213 9,447
Transportation equipment 2,732 2,732 86
Furniture and fixtures 127,202 129,533 4,049
Leased assets 4,712 4,712 147
Leasehold improvements 95,208 96,014 3,001
Total cost 11,015,603 12,606,301 394,070
Less: Accumulated depreciation ( 3,728,827 ) ( 4,321,855 ) ( 135,100 )
Prepayments for construction-in-progress and equipment-in-transit 88,875 29,731 929
Properties, net 7,375,651 8,314,177 259,899
OTHER ASSETS
Assets leased to others 309,959 48,135 1,505
Refundable deposits 117,464 69,166 2,163
Deferred charges (Note 2) 52,125 69,773 2,181
Deferred income tax assets (Notes 2 and 22) 821,144 1,066,101 33,326
Restricted assets (Notes 2 and 26) - 63,900 1,997
Other (Notes 2, 11 and 18) 117,138 1,980,823 61,920
Total other assets 1,417,830 3,297,898 103,092
TOTAL $ 115,226,362 $ 119,143,448 $ $3,724,397
The accompanying notes are an integral part of the financial statements.
(With Deloitte & Touche audit report dated January 18, 2010)
)LQDQFLDO,QIRUPDWLRQ