HTC 2009 Annual Report Download - page 45
Download and view the complete annual report
Please find page 45 of the 2009 HTC annual report below. You can navigate through the pages in the report by either clicking on the pages listed below, or by using the keyword search tool below to find specific information within the annual report.-
 1
1 -
2
-
3
-
4
-
5
-
6
-
7
-
8
-
9
-
10
-
11
-
12
-
13
-
14
-
15
-
16
-
17
-
18
-
19
-
20
-
21
-
22
-
23
-
24
-
25
-
26
-
27
-
28
-
29
-
30
-
31
-
32
-
33
-
34
-
 35
35 -
 36
36 -
 37
37 -
 38
38 -
 39
39 -
 40
40 -
 41
41 -
 42
42 -
 43
43 -
 44
44 -
 45
45 -
 46
46 -
 47
47 -
 48
48 -
 49
49 -
 50
50 -
 51
51 -
 52
52 -
 53
53 -
 54
54 -
 55
55 -
56
-
57
-
58
-
59
-
60
-
61
-
62
-
63
-
64
-
65
-
66
-
67
-
68
-
69
-
70
-
71
-
72
-
73
-
74
-
75
-
76
-
77
-
78
-
79
-
80
-
81
-
82
-
83
-
84
-
85
-
86
-
87
-
88
-
89
-
90
-
91
-
92
-
93
-
94
-
95
-
96
-
97
-
98
-
99
-
100
-
101
-
102
 |
 |

88 89
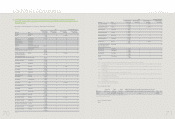
FINANCIAL STATUS, OPERATING RESULTS AND RISK MANAGEMEN
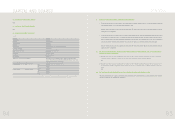
I. FINANCIAL STATUS
Unit
:
NT$1,000
Difference
Item 2009 2008 Amount %
Current Assets 101,025,179 101,271,990 (246,811) -
Long-term Investments 6,506,194 5,160,891 1,345,303 26
Properties 8,314,177 7,375,651 938,526 13
Other Assets 3,297,898 1,417,830 1,880,068 133
Total Assets 119,143,448 115,226,362 3,917,086 3
Current Liabilities 53,501,788 54,558,470 (1,056,682) (2)
Long-term Liabilities ----
Other Liabilities 1,210 6,406 (5,196) (81)
Total Liabilities
53,502,998 54,564,876 (1,061,878) (2)
Capital Stock 7,889,358 7,553,938 335,420 4
Capital Surplus 9,099,923 4,417,534 4,682,389 106
Retained Earnings 48,637,773 52,036,321 (3,398,548) (7)
Equity Adjustments 13,396 63,970 (50,574) (79)
Treasury Stock -(3,410,277) 3,410,277 (100)
Total Stockholders' Equity 65,640,450 60,661,486 4,978,964 8
Explanations of the main reasons for and the impact of any material changes in HTC's assets, liabilities, and shareholders' equity in the most
recent two fiscal years:
1. Long-term investments rose for the period, primarily in response to production planning needs. HTC increased investment in High Tech Computer Asia Pacific Pte., Ltd. in order
to support HTC Electronics (Shanghai) Co., Ltd. factory construction. Investment funds were also allocated in 2009 to establish HTC I Investment Corporation and Huada Digital
Corporation, both of which will take on strategic investment responsibilities.
2. The increase in properties for the period is principally due to land purchase for use in the development of the HTC Taoyuan Campus. The increase in other assets during the period
was tied primarily to royalty prepayments necessary to secure advantageous pricing arrangements.
3. HTC current liabilities include accrued marketing and advertising expenses, estimated employee bonus and normal reserve for warranty expenses. As a result, the total current lia-
bilities to total assets ratio is relatively high.
4. Capital surplus increased during the period primarily due to distribution of earnings plan for fiscal 2008 approved in 2009 shareholders' meeting. A portion of employee bonuses
was distributed in the form of HTC stock shares, while fair value of equity securities was used to calculate the number of shares to transfer to capital. The difference between fair
value and par value of NT$4.8 billion was recorded as capital surplus.
5. The increase in equity adjustments for the period is largely the result of exchange rate fluctuations. Long-term equity investments recognized under the equity method were adjust-
ed to reflect exchange rate differences;
6. This period recorded a reduction in treasury stock mainly due to corporate retirement of shares.
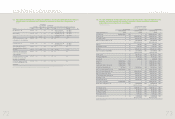
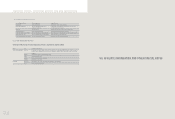
II. OPERATING RESULTS
Unit
:
NT$1,000
Item 2009 2008 Difference %
Revenues 144,880,715 152,558,766 (7,678,051) (5)
Cost of Revenues 99,018,232 101,916,912 (2,898,680) (3)
Gross Profit 45,862,483 50,641,854 (4,779,371) (9)
(Unrealized) Realized Profit From Intercompany Transactions 25,941 40,984 (15,043) (37)
Realized Gross Profit 45,888,424 50,682,838 (4,794,414) (9)
Operating Expenses 21,713,430 20,426,453 1,286,977 6
Operating Income 24,174,994 30,256,385 (6,081,391) (20)
Nonoperating Income and Gains 1,623,362 2,300,018 (676,656) (29)
Nonoperating Expenses and Losses 585,892 965,924 (380,032) (39)
Income From Continuing Operations Before Income Tax 25,212,464 31,590,479 (6,378,015) (20)
Income Tax (2,603,562) (2,955,130) 351,568 (12)
Income From Continuing Operations 22,608,902 28,635,349 (6,026,447) (21)
Analysis and explanation of the percentage of increase/decrease for the most recent two fiscal years:
1. Revenues, cost of revenues and gross profit all declined from the previous period. Challenges arising in the general business environment and changes in growth rates for the var-
ious mobile phone operating systems combined to reduced overall HTC shipment units by 2.6% as compared to the previous period. Average selling price also fell 3.5%.
However, HTC's gross profit of 31.7% was 1.5 percentage points less than the previous period - a number that reflects positively on the efforts made by HTC to optimize cost
structures.
2. Realized profit from intercompany transactions decreased over the previous period due primarily to higher inventories of HTC products held by the subsidiaries at the end of the
accounting period.
3. The rise in operating expenses recorded over the previous reporting period is principally due to HTC investments in building HTC brand value and brand awareness. HTC rolled
out its worldwide YOU campaign throughout key American and European markets, while concurrently enhancing channel management.
4. Nonoperating income and gains declined during the period primarily due to lower interest income resulting from falling interest rates. HTC engages in forward foreign exchange
(forex) trading to minimize exchange fluctuation risk. The significant instability in forex markets during the period resulted in attendant gains on foreign exchange transactions and
losses in valuation, recorded, respectively as non-operating income and non-operating expenses. Thus, increased instability on forex markets during the period resulted in lower
nonoperating expenses and losses.
III. CASH FLOWS
(1) Analysis of change in cash flow for the most recent fiscal year
Unit
:
NT$1,000
Item 2009 2008 %
Cash Flow Ratio (%) 51 69 (26)
Cash Flow Adequacy Ratio (%) 201 221 (9)
Cash Flow Reinvestment Ratio (%) 11 28 (61)
Explanation and analysis of change in increase/decrease ratios (a change from the previous period of 20 percent or more):
1. The drop in the cash flow ratio for the period was attributable primarily to HTC's smaller net profit and rises in royalty prepayments. The net cash provided by operating activities
fell 27%, which shrunk the cash flow ratio.
2. The NT$6 billion reduction in net profit sustained during 2009 coupled with an increase in royalty prepayments to reduce net cash provided by operating activities by some NT$10
billion. Also, cash dividends amounting to NT$60 million more than distributed during the previous period resulted in a divisor (net cash provided by operating activities - cash
dividends) 59% smaller than that of the previous period. The above combined to result in the smaller cash reinvestment ratio recorded this period.
(2) Cash liquidity analysis for the coming year
Unit
:
NT$1,000
Beginning cash balance Projected whole-year cash flow Projected whole-year Projected cash surplus Remedial measures for projected cash deficit
from operating activities cash outflow (deficit) amount Investment plan Financial manageme nt plan
61,676,464 28,652,947 31,370,729 58,958,682 - -
Remedial measures for projected cash deficit: Not Applicable
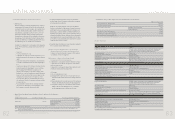
IV. THE EFFECT ON FINANCIAL OPERATIONS OF MATERIAL CAPITAL EXPENDITURES DURING THE MOST
RECENT FISCAL YEAR
(1) Review and analysis of material capital expenditures and funding sources
1. Material capital expenditure utilization and funding sources
Unit
:
NT$1,000
Planned items Actual or projected Actual or projected Total capital needed Actual or projected capital utilization
sources of capital date of completion (as of FY2010) 2006 2007 2008 2009 2010
Purchase and Installation of Equipment / Facilities working capital 2006~2010
2,527,171 635,621 141,896
621,256
172,187
956,211
Plant Construction working capital 2006~2010
7,917,435 386,809 1,193,133
3,903,243
1,164,600
1,269,650
2. Anticipated Benefits
(1) Plant Construction: Construction of HTC Campus and a new Taipei R&D building will provide employees with suitably designed and furnished work environments to support
and enhance long-term, sustained business operations.
(2) Purchase / Installation of Equipment and Facilities: Replacement / upgrade of equipment and facilities is essential to raising productivity and reducing overall costs of doing
business, and to supporting HTC's market share and operating profit margin.
V. STATUS OF INVESTMENT DIVERSIFICATION DURING CURRENT YEAR
(1) Analysis of Equity Investments
Unit
:
NT$1,000
Item Amount (Note)Policy Primary reason for profits or losses Corrective plans Other future investment plans
High Tech Computer Aisa Pacific Pte. Ltd. 1,339,311 Investment holding Gains by the invested enterprise -Please refer to (2)
HTC I Investment Corporation 295,000 Investment holding In a start-up phase -Please refer to (2)
Note 1: Reflecting HTC's internal reorganization of overseas investments, we have reduced fiscal year 2009 investments in H.T.C. (B.V.I.) Corp. and HTC HK, Limited by NT$682,221 thousands and NT$1,277 thou-
sands respectively. Both aforementioned companies engage in global investing activities. Earnings from investments in these subsidiaries during 2009 resulted in recognized equity gains of NT$229,301
thousands and NT$11,522 thousands, respectively.
Note 2: HTC Investment Corporation and Vitamin D, Inc. were two companies newly invested by HTC in 2008 with, respectively, NT$300,000 thousands and NT$7,956 thousands in capitalization. The HTC
Investment Corporation, which engages in general investing activities, was in 2009 still in a start-up phase and, therefore, reported minimal investment gains of NT$462 thousands. Vitamin D, Inc. is engaged
in application software development and, due to business losses during 2009, recognized an investment loss for the year of NT$3,891 thousands.