HTC 2009 Annual Report Download - page 18
Download and view the complete annual report
Please find page 18 of the 2009 HTC annual report below. You can navigate through the pages in the report by either clicking on the pages listed below, or by using the keyword search tool below to find specific information within the annual report.-
 1
1 -
2
-
3
-
4
-
5
-
6
-
7
-
 8
8 -
 9
9 -
 10
10 -
 11
11 -
 12
12 -
 13
13 -
 14
14 -
 15
15 -
 16
16 -
 17
17 -
 18
18 -
 19
19 -
 20
20 -
 21
21 -
 22
22 -
 23
23 -
 24
24 -
 25
25 -
 26
26 -
 27
27 -
 28
28 -
29
-
30
-
31
-
32
-
33
-
34
-
35
-
36
-
37
-
38
-
39
-
40
-
41
-
42
-
43
-
44
-
45
-
46
-
47
-
48
-
49
-
50
-
51
-
52
-
53
-
54
-
55
-
56
-
57
-
58
-
59
-
60
-
61
-
62
-
63
-
64
-
65
-
66
-
67
-
68
-
69
-
70
-
71
-
72
-
73
-
74
-
75
-
76
-
77
-
78
-
79
-
80
-
81
-
82
-
83
-
84
-
85
-
86
-
87
-
88
-
89
-
90
-
91
-
92
-
93
-
94
-
95
-
96
-
97
-
98
-
99
-
100
-
101
-
102
 |
 |

34
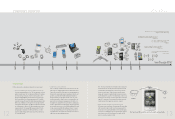
In terms of key components supply, rising global shipments of mobile
phones during 4Q 2009 saw production capacity utilization levels rise for
upstream components suppliers starting from early 3Q. Demand during this
period began to outstrip supply for certain components. Apart from persist-
ent efforts to ensure stable deliveries, HTC negotiates proactively with its
suppliers to secure better pricing contracts. Components that have recently
seen the most significant price reductions include medium and small-
dimension touch panels and display modules. HTC contracts guaranteeing
supply at advantageous prices have helped keep supplies relatively steady in
spite of the tight component supply situation in the general market.
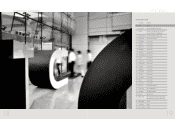
With worldwide demand for mobile phones expected to continue rising
through 2010, we can expect the tight supply situation to continue as well. In
addition to ensuring that all components continue to be delivered on sched-
ule, HTC will continue to press suppliers to raise production efficiencies in
order to further lower production costs, which should transfer into even
lower input costs for HTC and result in mutual advantage to both parties.
Particularly when supplies are tight, HTC works to negotiate supply guaran-
tees against future production in order to lower overall purchase costs and
achieve the most advantageous cost structure possible.
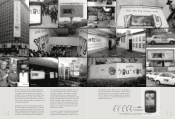
Market Analysis
Prospects continue to be strong for sustained vigorous growth in the smart
phone sector. Rising consumer demand for high data transfer speeds for
mobile internet communications coupled with the arrival of the mobile
Internet era have led mobile phone designers and telecommunication serv-
ice providers into closer alliances in order to roll out an increasingly
diverse array of mobile digital services to satisfy consumer demand. Smart
phones have entered the mass market.
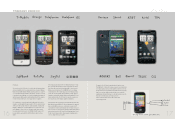
Apart from encouraging current competitors to redouble efforts and invest-
ments, rapidly rising smart phone user and market penetration rates have
encouraged potential competitors to join the fray. Many major mobile
phone makers, responding to the newly open source operating system- Android
OS, have already begun investing in related design and R&D efforts. With a
potential for growth that simply cannot be underestimated, other established
operating systems such as Symbian, Windows Mobile and Blackberry are also
being upgraded and enhanced. Competition in the smart phone sector is set to
become even more intense.
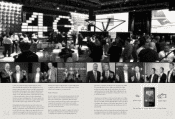
The primary use of smart phones is in the area of mobile digital services. Mobile
phone advertising services provider AdMob, analyzing mobile phone advertising
data requests worldwide, claimed that Android OS phones held 16% of total glob-
al smart phone advertising requests in 4Q 2009; up sharply from just 1% in 4Q
2008. The analysis pointed to the Android OS share in North America (27%) as
particularly high.
Benefitting from the meteoric rise of Android, the requests of mobile phone adver-
tising handled by HTC phones has similarly shot up from 1% in 4Q 2008 to 6%
in 4Q 2009. Recent changes in market share amply demonstrate the significant 35