HTC 2009 Annual Report Download - page 96
Download and view the complete annual report
Please find page 96 of the 2009 HTC annual report below. You can navigate through the pages in the report by either clicking on the pages listed below, or by using the keyword search tool below to find specific information within the annual report.-
 1
1 -
2
-
3
-
4
-
5
-
6
-
7
-
8
-
9
-
10
-
11
-
12
-
13
-
14
-
15
-
16
-
17
-
18
-
19
-
20
-
21
-
22
-
23
-
24
-
25
-
26
-
27
-
28
-
29
-
30
-
31
-
32
-
33
-
34
-
35
-
36
-
37
-
38
-
39
-
40
-
41
-
42
-
43
-
44
-
45
-
46
-
47
-
48
-
49
-
50
-
51
-
52
-
53
-
54
-
55
-
56
-
57
-
58
-
59
-
60
-
61
-
62
-
63
-
64
-
65
-
66
-
67
-
68
-
69
-
70
-
71
-
72
-
73
-
74
-
75
-
76
-
77
-
78
-
79
-
80
-
81
-
82
-
83
-
84
-
85
-
 86
86 -
 87
87 -
 88
88 -
 89
89 -
 90
90 -
 91
91 -
 92
92 -
 93
93 -
 94
94 -
 95
95 -
 96
96 -
 97
97 -
 98
98 -
 99
99 -
 100
100 -
 101
101 -
 102
102
 |
 |

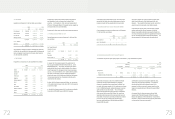
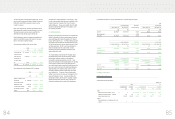
The related EPS information for the years ended December 31, 2008 and 2009 was as follows:
2008
Amount (Numerator) Denominator EPS (In Dollars)
Before Income Tax After Income Tax Shares(Thousands) Before Income Tax After Income Tax
NT$ NT$ NT$ NT$
Basic EPS $31,590,479 $28,635,349 791,855 $39.89 $36.16
Bonus to employees - - 27,400
Diluted EPS $31,590,479 $28,635,349 819,255 $38.56 $34.95
2009
Amount (Numerator) Denominator EPS (In Dollars)
Before Income Tax After Income Tax Shares(Thousands) Before Income Tax After Income Tax
NT$ NT$ NT$ NT$
Basic EPS $25,212,464 $22,608,902 787,367 $32.02 $28.71
Bonus to employees - - 15,044
Diluted EPS $25,212,464 $22,608,902 802,411 $31.42 $28.18
2009
Amount (Numerator) Denominator EPS (In Dollars)
Before Income Tax After Income Tax Shares(Thousands) Before Income Tax After Income Tax
US$ (Note 3) US$ (Note 3) US$ (Note 3) US$ (Note 3)
Basic EPS $788,136 $706,749 787,367 $1.00 $0.90
Bonus to employees - - 15,044
Diluted EPS $788,136 $706,749 802,411 $0.98 $0.88
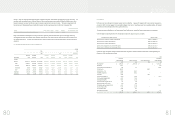
26. FINANCIAL INSTRUMENTS
Fair Value of Financial Instruments
a. Nonderivative financial instruments
December 31
2008 2009
Carrying Amount Fair Value Carrying Amount Fair Value
NT$ NT$ NT$ US$ (Note 3) NT$ US$ (Note 3)
Assets
Available-for-sale financial assets - current $ - $ - $ 2,497,394 $ 78,068 $ 2,497,394 $ 78,068
Available-for-sale financial assets – noncurrent 339 339 313 10 313 10
Financial assets carried at cost 501,192 501,192 565,172 17,667 565,172 17,667
Liabilities
Financial liabilities at fair value through profit or loss
- current 6 6 -- - -
)LQDQFLDO,QIRUPDWLRQ
The loss carryforwards of HTC Electronics (Shanghai) Co., Ltd. that
gave rise to deferred tax assets in People's Republic of China were
NT$5,049 thousand (US$158 thousand) and could be carried
forward for four years.
Based on the Income Tax Act of the ROC, the investment research
and development tax credits can be carried forward for four years.
The total credits used in each year cannot exceed half of the
estimated income tax provision, except in the last year.
Valuation allowance is based on management’s evaluation of the
amount of tax credits that can be carried forward for four years,
based on the Company’s financial forecasts.
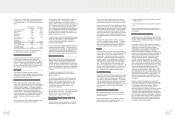
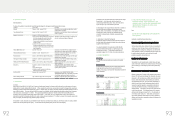
The income taxes in 2008 and 2009 were as follows:
2008 2009
NT$ NT$ US$ (Note 3)
Current income tax $ 3,601,398 $ 3,383,532 $ 105,769
Increase in deferred
income tax assets ( 409,268 ) ( 506,522 ) ( 15,834 )
Overestimation of
prior year’s income
tax ( 8,940 )
( 95,011 ) ( 2,970 )
Income tax $ 3,183,190 $ 2,781,999 $ 86,965
The integrated income tax information of HTC is as follows:
2008 2009
NT$ NT$
US$ (Note
3)
Balance of imputation credit
account (ICA) $ 4,365,460 $ 1,702,246 $ 53,212
Unappropriated earnings
generated from 1998 44,626,182 38,364,099 1,199,253
Actual/estimated creditable
ratio (including income tax
payable)
10.55% 12.71% 12.71%
(actual
ratio)
(estimated
ratio)
(estimated
ratio)
For distribution of earnings generated on or after January 1, 1998,
the ratio for the imputation credits allocated to stockholders of the
Company is based on the balance of the ICA as of the date of
dividend distribution. The expected creditable ratio for the 2008
earnings may be adjusted, depending on the ICA balance on the
date of dividend distribution.
25. EARNINGS PER SHARE
Earnings per share (EPS) before tax and after tax are calculated by
dividing net income by the weighted average number of common
shares outstanding which includes the deduction of the effect of
treasury stock during each year. The weighted average number of
shares used in EPS calculation was 791,855 thousand shares and
787,367 thousand shares for the years ended December 31, 2008
and 2009, respectively. EPS for the year ended December 31,
2008 were calculated after the average number of shares
outstanding was adjusted retroactively for the effect of stock
dividend distribution in 2009.
The Accounting Research and Development Foundation issued
Interpretation 2007-052 that requires companies to recognize
bonuses paid to employees, directors and supervisors as
compensation expenses beginning January 1, 2008. These
bonuses were previously recorded as appropriations from earnings.
If the Company may settle the bonus to employees by cash or
shares, the Company should presume that the entire amount of the
bonus will be settled in shares and the resulting potential shares
should be included in the weighted average number of shares
outstanding used in the calculation of diluted EPS, if the shares
have a dilutive effect. The number of shares is estimated by
dividing the entire amount of the bonus by the closing price of the
shares at the balance sheet date. Such dilutive effects of the
potential shares needs to be included in the calculation of diluted
EPS until the stockholders resolve the number of shares to be
distributed to employees at their meeting in the following year.
)LQDQFLDO,QIRUPDWLRQ