HP 2010 Annual Report Download - page 98
Download and view the complete annual report
Please find page 98 of the 2010 HP annual report below. You can navigate through the pages in the report by either clicking on the pages listed below, or by using the keyword search tool below to find specific information within the annual report.-
 1
1 -
2
-
3
-
4
-
5
-
6
-
7
-
8
-
9
-
10
-
11
-
12
-
13
-
14
-
15
-
16
-
17
-
18
-
19
-
20
-
21
-
22
-
23
-
24
-
25
-
26
-
27
-
28
-
29
-
30
-
31
-
32
-
33
-
34
-
35
-
36
-
37
-
38
-
39
-
40
-
41
-
42
-
43
-
44
-
45
-
46
-
47
-
48
-
49
-
50
-
51
-
52
-
53
-
54
-
55
-
56
-
57
-
58
-
59
-
60
-
61
-
62
-
63
-
64
-
65
-
66
-
67
-
68
-
69
-
70
-
71
-
72
-
73
-
74
-
75
-
76
-
77
-
78
-
79
-
80
-
81
-
82
-
83
-
84
-
85
-
86
-
87
-
 88
88 -
 89
89 -
 90
90 -
 91
91 -
 92
92 -
 93
93 -
 94
94 -
 95
95 -
 96
96 -
 97
97 -
 98
98 -
 99
99 -
 100
100 -
 101
101 -
 102
102 -
 103
103 -
 104
104 -
 105
105 -
 106
106 -
 107
107 -
 108
108 -
109
-
110
-
111
-
112
-
113
-
114
-
115
-
116
-
117
-
118
-
119
-
120
-
121
-
122
-
123
-
124
-
125
-
126
-
127
-
128
-
129
-
130
-
131
-
132
-
133
-
134
-
135
-
136
-
137
-
138
-
139
-
140
-
141
-
142
-
143
-
144
-
145
-
146
-
147
-
148
-
149
-
150
-
151
-
152
-
153
-
154
-
155
-
156
-
157
-
158
-
159
-
160
-
161
-
162
-
163
-
164
-
165
-
166
-
167
-
168
-
169
-
170
-
171
-
172
-
173
-
174
-
175
-
176
-
177
-
178
-
179
-
180
 |
 |

HEWLETT-PACKARD COMPANY AND SUBSIDIARIES
Notes to Consolidated Financial Statements (Continued)
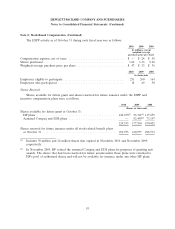
Note 2: Stock-Based Compensation (Continued)
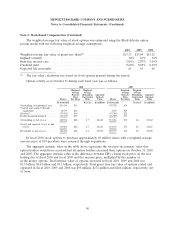
The weighted-average fair value of stock options was estimated using the Black-Scholes option
pricing model with the following weighted-average assumptions:
2010 2009 2008
Weighted-average fair value of grants per share(1) .................... $13.33 $13.04 $15.26
Implied volatility ............................................ 30% 43% 34%
Risk-free interest rate ........................................ 2.06% 2.07% 3.09%
Dividend yield ............................................. 0.68% 0.92% 0.69%
Expected life in months ....................................... 61 61 60
(1) The fair value calculation was based on stock options granted during the period.
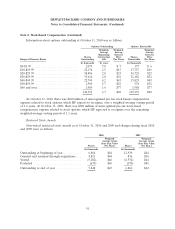
Option activity as of October 31 during each fiscal year was as follows:
2010 2009
Weighted- Weighted- Weighted- Weighted-
Average Average Average Average
Exercise Remaining Aggregate Exercise Remaining Aggregate
Price Contractual Intrinsic Price Contractual Intrinsic
Shares Per Share Term Value Shares Per Share Term Value
In thousands In years In millions In thousands In years In millions
Outstanding at beginning of year . . 233,214 $33 307,728 $34
Granted and assumed through
acquisitions ............. 11,939 $22 2,190 $29
Exercised ................ (75,002) $34 (55,784) $28
Forfeited/cancelled/expired ...... (27,235) $55 (20,920) $57
Outstanding at end of year ..... 142,916 $28 2.7 $2,140 233,214 $33 2.6 $3,643
Vested and expected to vest at end
of year ................ 141,082 $28 2.7 $2,114 231,134 $33 2.6 $3,623
Exercisable at end of year ...... 125,232 $28 2.1 $1,895 207,757 $32 2.2 $3,399
In fiscal 2010, stock options to purchase approximately 10 million shares with a weighted-average
exercise price of $19 per share were assumed through acquisitions.
The aggregate intrinsic value in the table above represents the total pre-tax intrinsic value that
option holders would have received had all option holders exercised their options on October 31, 2010
and 2009. The aggregate intrinsic value is the difference between HP’s closing stock price on the last
trading day of fiscal 2010 and fiscal 2009 and the exercise price, multiplied by the number of
in-the-money options. Total intrinsic value of options exercised in fiscal 2010, 2009 and 2008 was
$1.3 billion, $0.8 billion and $1.1 billion, respectively. Total grant date fair value of options vested and
expensed in fiscal 2010, 2009 and 2008 was $93 million, $172 million and $264 million, respectively, net
of taxes.
90