HP 2010 Annual Report Download - page 63
Download and view the complete annual report
Please find page 63 of the 2010 HP annual report below. You can navigate through the pages in the report by either clicking on the pages listed below, or by using the keyword search tool below to find specific information within the annual report.-
 1
1 -
2
-
3
-
4
-
5
-
6
-
7
-
8
-
9
-
10
-
11
-
12
-
13
-
14
-
15
-
16
-
17
-
18
-
19
-
20
-
21
-
22
-
23
-
24
-
25
-
26
-
27
-
28
-
29
-
30
-
31
-
32
-
33
-
34
-
35
-
36
-
37
-
38
-
39
-
40
-
41
-
42
-
43
-
44
-
45
-
46
-
47
-
48
-
49
-
50
-
51
-
52
-
 53
53 -
 54
54 -
 55
55 -
 56
56 -
 57
57 -
 58
58 -
 59
59 -
 60
60 -
 61
61 -
 62
62 -
 63
63 -
 64
64 -
 65
65 -
 66
66 -
 67
67 -
 68
68 -
 69
69 -
 70
70 -
 71
71 -
 72
72 -
 73
73 -
74
-
75
-
76
-
77
-
78
-
79
-
80
-
81
-
82
-
83
-
84
-
85
-
86
-
87
-
88
-
89
-
90
-
91
-
92
-
93
-
94
-
95
-
96
-
97
-
98
-
99
-
100
-
101
-
102
-
103
-
104
-
105
-
106
-
107
-
108
-
109
-
110
-
111
-
112
-
113
-
114
-
115
-
116
-
117
-
118
-
119
-
120
-
121
-
122
-
123
-
124
-
125
-
126
-
127
-
128
-
129
-
130
-
131
-
132
-
133
-
134
-
135
-
136
-
137
-
138
-
139
-
140
-
141
-
142
-
143
-
144
-
145
-
146
-
147
-
148
-
149
-
150
-
151
-
152
-
153
-
154
-
155
-
156
-
157
-
158
-
159
-
160
-
161
-
162
-
163
-
164
-
165
-
166
-
167
-
168
-
169
-
170
-
171
-
172
-
173
-
174
-
175
-
176
-
177
-
178
-
179
-
180
 |
 |

HEWLETT-PACKARD COMPANY AND SUBSIDIARIES
Management’s Discussion and Analysis of
Financial Condition and Results of Operations (Continued)
in gross margin and a decrease in operating expenses as a percentage of net revenue. The increase in
gross margin in fiscal 2010 was primarily a result of a higher license and support mix, the effect of
which was partially offset by a reduced services gross margin rate. The decrease in operating expenses
as a percentage of net revenue in fiscal 2010 was due primarily to lower field selling, administrative and
acquisition integration costs.
HP Software net revenue decreased 15.4% (10.8% when adjusted for currency) in fiscal 2009, due
to softening in enterprise spending and declines in large deals. For fiscal 2009, revenue from licenses
and services declined, the effect of which was partially offset by increased support revenue as a result
of renewal rate increases. Net revenue from BTO decreased 15% in fiscal 2009 as compared to fiscal
2008. Net revenue from other software decreased 17% in fiscal 2009 as compared to fiscal 2008, due to
declines in revenues for communication and media solutions, business intelligence solutions and
information management.
HP Software earnings from operations as a percentage of net revenue increased by 7.3 percentage
points in fiscal 2009. The operating margin improvement in fiscal 2009 was due primarily to increased
gross margin coupled with decreased operating expenses as a percentage of net revenue. The increase
in gross margin in fiscal 2009 resulted primarily from a favorable support and services revenue mix and
improved services margins, the effect of which was partially offset by an unfavorable license revenue
mix. The decrease in operating expenses as a percentage of net revenue in fiscal 2009 was due
primarily to continued cost controls.
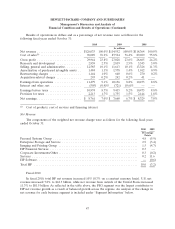
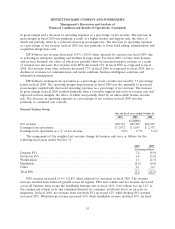
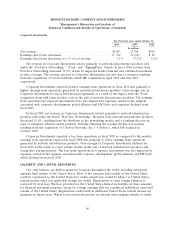
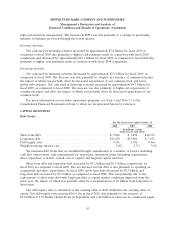
Personal Systems Group
For the fiscal years ended October 31
2010 2009 2008
In millions
Net revenue ........................................... $40,741 $35,305 $42,295
Earnings from operations ................................. $ 2,032 $ 1,661 $ 2,375
Earnings from operations as a % of net revenue ................ 5.0% 4.7% 5.6%
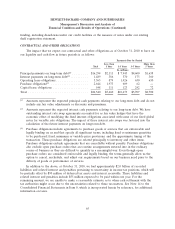
The components of the weighted net revenue change by business unit were as follows for the
following fiscal years ended October 31:
2010 2009
Percentage Points
Desktop PCs ..................................................... 7.4 (8.9)
Notebook PCs .................................................... 6.6 (5.8)
Workstations ..................................................... 1.5 (1.5)
Handhelds ....................................................... (0.2) (0.4)
Other .......................................................... 0.1 0.1
Total PSG ....................................................... 15.4 (16.5)
PSG revenue increased 15.4% (12.8% when adjusted for currency) in fiscal 2010. The revenue
increase resulted from balanced growth across all regions. PSG unit volume and net revenue increased
across all business units except the handhelds business unit in fiscal 2010. Unit volume was up 14% as
the commercial refresh cycle and continued demand for consumer notebooks drove an increase in
shipments. In fiscal 2010, net revenue from notebook PCs increased 12% while desktop PCs revenue
increased 20%. Workstations revenue increased 42% while handhelds revenue declined 49%. In fiscal
55