HP 2010 Annual Report Download - page 81
Download and view the complete annual report
Please find page 81 of the 2010 HP annual report below. You can navigate through the pages in the report by either clicking on the pages listed below, or by using the keyword search tool below to find specific information within the annual report.-
 1
1 -
2
-
3
-
4
-
5
-
6
-
7
-
8
-
9
-
10
-
11
-
12
-
13
-
14
-
15
-
16
-
17
-
18
-
19
-
20
-
21
-
22
-
23
-
24
-
25
-
26
-
27
-
28
-
29
-
30
-
31
-
32
-
33
-
34
-
35
-
36
-
37
-
38
-
39
-
40
-
41
-
42
-
43
-
44
-
45
-
46
-
47
-
48
-
49
-
50
-
51
-
52
-
53
-
54
-
55
-
56
-
57
-
58
-
59
-
60
-
61
-
62
-
63
-
64
-
65
-
66
-
67
-
68
-
69
-
70
-
 71
71 -
 72
72 -
 73
73 -
 74
74 -
 75
75 -
 76
76 -
 77
77 -
 78
78 -
 79
79 -
 80
80 -
 81
81 -
 82
82 -
 83
83 -
 84
84 -
 85
85 -
 86
86 -
 87
87 -
 88
88 -
 89
89 -
 90
90 -
 91
91 -
92
-
93
-
94
-
95
-
96
-
97
-
98
-
99
-
100
-
101
-
102
-
103
-
104
-
105
-
106
-
107
-
108
-
109
-
110
-
111
-
112
-
113
-
114
-
115
-
116
-
117
-
118
-
119
-
120
-
121
-
122
-
123
-
124
-
125
-
126
-
127
-
128
-
129
-
130
-
131
-
132
-
133
-
134
-
135
-
136
-
137
-
138
-
139
-
140
-
141
-
142
-
143
-
144
-
145
-
146
-
147
-
148
-
149
-
150
-
151
-
152
-
153
-
154
-
155
-
156
-
157
-
158
-
159
-
160
-
161
-
162
-
163
-
164
-
165
-
166
-
167
-
168
-
169
-
170
-
171
-
172
-
173
-
174
-
175
-
176
-
177
-
178
-
179
-
180
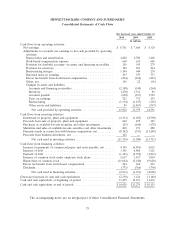
 |
 |

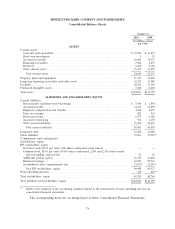
HEWLETT-PACKARD COMPANY AND SUBSIDIARIES
Consolidated Statements of Earnings
For the fiscal years ended October 31
2010 2009 2008
In millions, except per share amounts
Net revenue:
Products ........................................... $ 84,799 $ 74,051 $ 91,697
Services ............................................ 40,816 40,124 26,297
Financing income ..................................... 418 377 370
Total net revenue ................................... 126,033 114,552 118,364
Costs and expenses:
Cost of products ..................................... 65,064 56,503 69,342
Cost of services ...................................... 30,723 30,695 20,028
Financing interest .................................... 302 326 329
Research and development .............................. 2,959 2,819 3,543
Selling, general and administrative ........................ 12,585 11,613 13,326
Amortization of purchased intangible assets .................. 1,484 1,578 1,012
Restructuring charges .................................. 1,144 640 270
Acquisition-related charges .............................. 293 242 41
Total operating expenses .............................. 114,554 104,416 107,891
Earnings from operations ................................ 11,479 10,136 10,473
Interest and other, net ................................... (505) (721) —
Earnings before taxes ................................... 10,974 9,415 10,473
Provision for taxes ...................................... 2,213 1,755 2,144
Net earnings .......................................... $ 8,761 $ 7,660 $ 8,329
Net earnings per share:
Basic .............................................. $ 3.78 $ 3.21 $ 3.35
Diluted ............................................ $ 3.69 $ 3.14 $ 3.25
Weighted-average shares used to compute net earnings per share:
Basic .............................................. 2,319 2,388 2,483
Diluted ............................................ 2,372 2,437 2,567
The accompanying notes are an integral part of these Consolidated Financial Statements.
73