HP 2010 Annual Report Download - page 67
Download and view the complete annual report
Please find page 67 of the 2010 HP annual report below. You can navigate through the pages in the report by either clicking on the pages listed below, or by using the keyword search tool below to find specific information within the annual report.-
 1
1 -
2
-
3
-
4
-
5
-
6
-
7
-
8
-
9
-
10
-
11
-
12
-
13
-
14
-
15
-
16
-
17
-
18
-
19
-
20
-
21
-
22
-
23
-
24
-
25
-
26
-
27
-
28
-
29
-
30
-
31
-
32
-
33
-
34
-
35
-
36
-
37
-
38
-
39
-
40
-
41
-
42
-
43
-
44
-
45
-
46
-
47
-
48
-
49
-
50
-
51
-
52
-
53
-
54
-
55
-
56
-
 57
57 -
 58
58 -
 59
59 -
 60
60 -
 61
61 -
 62
62 -
 63
63 -
 64
64 -
 65
65 -
 66
66 -
 67
67 -
 68
68 -
 69
69 -
 70
70 -
 71
71 -
 72
72 -
 73
73 -
 74
74 -
 75
75 -
 76
76 -
 77
77 -
78
-
79
-
80
-
81
-
82
-
83
-
84
-
85
-
86
-
87
-
88
-
89
-
90
-
91
-
92
-
93
-
94
-
95
-
96
-
97
-
98
-
99
-
100
-
101
-
102
-
103
-
104
-
105
-
106
-
107
-
108
-
109
-
110
-
111
-
112
-
113
-
114
-
115
-
116
-
117
-
118
-
119
-
120
-
121
-
122
-
123
-
124
-
125
-
126
-
127
-
128
-
129
-
130
-
131
-
132
-
133
-
134
-
135
-
136
-
137
-
138
-
139
-
140
-
141
-
142
-
143
-
144
-
145
-
146
-
147
-
148
-
149
-
150
-
151
-
152
-
153
-
154
-
155
-
156
-
157
-
158
-
159
-
160
-
161
-
162
-
163
-
164
-
165
-
166
-
167
-
168
-
169
-
170
-
171
-
172
-
173
-
174
-
175
-
176
-
177
-
178
-
179
-
180
 |
 |

HEWLETT-PACKARD COMPANY AND SUBSIDIARIES
Management’s Discussion and Analysis of
Financial Condition and Results of Operations (Continued)
asset-intensive and uses certain internal metrics to measure its performance against other financial
services companies, including a segment balance sheet that is derived from our internal management
reporting system. The accounting policies used to derive these amounts are substantially the same as
those used by the consolidated company. However, certain intercompany loans and accounts that are
reflected in the segment balances are eliminated in our Consolidated Financial Statements.
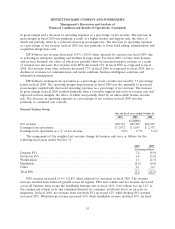
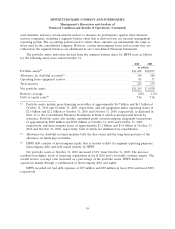
The portfolio assets and ratios derived from the segment balance sheet for HPFS were as follows
for the following fiscal years ended October 31:
2010 2009
In millions
Portfolio assets(1) ................................................. $11,418 $10,017
Allowance for doubtful accounts(2) .................................... 140 108
Operating lease equipment reserve .................................... 83 71
Total reserves ................................................... 223 179
Net portfolio assets ............................................... $11,195 $ 9,838
Reserve coverage ................................................ 2.0% 1.8%
Debt to equity ratio(3) ............................................. 7.0x 7.0x
(1) Portfolio assets include gross financing receivables of approximately $6.7 billion and $6.1 billion at
October 31, 2010 and October 31, 2009, respectively, and net equipment under operating leases of
$2.5 billion and $2.2 billion at October 31, 2010 and October 31, 2009, respectively, as disclosed in
Note 11 to the Consolidated Financial Statements in Item 8, which is incorporated herein by
reference. Portfolio assets also include capitalized profit on intercompany equipment transactions
of approximately $800 million and $700 million at October 31, 2010 and October 31, 2009,
respectively, and intercompany leases of approximately $1.3 billion and $1.0 billion at October 31,
2010 and October 31, 2009, respectively, both of which are eliminated in consolidation.
(2) Allowance for doubtful accounts includes both the short-term and the long-term portions of the
allowance on financing receivables.
(3) HPFS debt consists of intercompany equity that is treated as debt for segment reporting purposes,
intercompany debt and debt issued directly by HPFS.
Net portfolio assets at October 31, 2010 increased 13.8% from October 31, 2009. The increase
resulted from higher levels of financing originations in fiscal 2010 and a favorable currency impact. The
overall reserve coverage ratio increased as a percentage of the portfolio assets. HPFS funds its
operations mainly through a combination of intercompany debt and equity.
HPFS recorded net bad debt expenses of $75 million and $50 million in fiscal 2010 and fiscal 2009,
respectively.
59