HP 2010 Annual Report Download - page 53
Download and view the complete annual report
Please find page 53 of the 2010 HP annual report below. You can navigate through the pages in the report by either clicking on the pages listed below, or by using the keyword search tool below to find specific information within the annual report.-
 1
1 -
2
-
3
-
4
-
5
-
6
-
7
-
8
-
9
-
10
-
11
-
12
-
13
-
14
-
15
-
16
-
17
-
18
-
19
-
20
-
21
-
22
-
23
-
24
-
25
-
26
-
27
-
28
-
29
-
30
-
31
-
32
-
33
-
34
-
35
-
36
-
37
-
38
-
39
-
40
-
41
-
42
-
 43
43 -
 44
44 -
 45
45 -
 46
46 -
 47
47 -
 48
48 -
 49
49 -
 50
50 -
 51
51 -
 52
52 -
 53
53 -
 54
54 -
 55
55 -
 56
56 -
 57
57 -
 58
58 -
 59
59 -
 60
60 -
 61
61 -
 62
62 -
 63
63 -
64
-
65
-
66
-
67
-
68
-
69
-
70
-
71
-
72
-
73
-
74
-
75
-
76
-
77
-
78
-
79
-
80
-
81
-
82
-
83
-
84
-
85
-
86
-
87
-
88
-
89
-
90
-
91
-
92
-
93
-
94
-
95
-
96
-
97
-
98
-
99
-
100
-
101
-
102
-
103
-
104
-
105
-
106
-
107
-
108
-
109
-
110
-
111
-
112
-
113
-
114
-
115
-
116
-
117
-
118
-
119
-
120
-
121
-
122
-
123
-
124
-
125
-
126
-
127
-
128
-
129
-
130
-
131
-
132
-
133
-
134
-
135
-
136
-
137
-
138
-
139
-
140
-
141
-
142
-
143
-
144
-
145
-
146
-
147
-
148
-
149
-
150
-
151
-
152
-
153
-
154
-
155
-
156
-
157
-
158
-
159
-
160
-
161
-
162
-
163
-
164
-
165
-
166
-
167
-
168
-
169
-
170
-
171
-
172
-
173
-
174
-
175
-
176
-
177
-
178
-
179
-
180
 |
 |
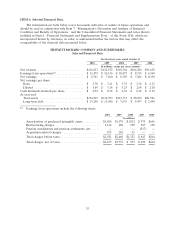
HEWLETT-PACKARD COMPANY AND SUBSIDIARIES
Management’s Discussion and Analysis of
Financial Condition and Results of Operations (Continued)
common stock and equivalents. In general, and where applicable, we use quoted prices in active
markets for identical assets to determine fair value. If quoted prices in active markets for identical
assets are not available to determine fair value, then we use quoted prices for similar assets and
liabilities or inputs that are observable either directly or indirectly. If quoted prices for identical or
similar assets are not available, we use internally developed valuation models, whose inputs include bid
prices, and third party valuations utilizing underlying asset assumptions.
Derivative Instruments: As discussed in Note 10 to the Consolidated Financial Statements in
Item 8, we mainly hold non-speculative forwards, swaps and options to hedge certain foreign currency
and interest rate exposures. When active market quotes are not available, we use industry standard
valuation models. Where applicable, these models project future cash flows and discount the future
amounts to a present value using market-based observable inputs including interest rate curves, credit
risk, foreign exchange rates, and forward and spot prices for currencies. In certain cases, market-based
observable inputs are not available and, in those cases, we use management judgment to develop
assumptions which are used to determine fair value.
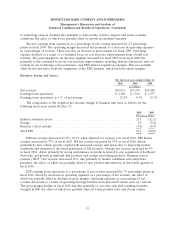
Retirement Benefits
Our pension and other post-retirement benefit costs and obligations are dependent on various
assumptions. Our major assumptions relate primarily to discount rates, salary growth, long-term return
on plan assets and medical cost trend rates. We base the discount rate assumption on current
investment yields of high quality fixed income investments during the retirement benefits maturity
period. The salary growth assumptions reflect our long-term actual experience and future and
near-term outlook. Long-term return on plan assets is determined based on historical portfolio results
and management’s expectation of the future economic environment, as well as target asset allocations.
Our medical cost trend assumptions are developed based on historical cost data, the near-term
outlook and an assessment of likely long-term trends. Actual results that differ from our assumptions
are accumulated and are amortized generally over the estimated future working life of the plan
participants.
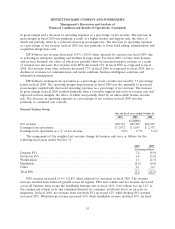
Our major assumptions vary by plan and the weighted-average rates used are set forth in Note 16
to the Consolidated Financial Statements in Item 8, which is incorporated herein by reference. Each
assumption has different sensitivity characteristics, and, in general, changes, if any, have moved in the
same direction over the last several years. For fiscal 2010, changes in the weighted-average rates for the
HP benefit plans would have had the following impact on our net periodic benefit cost:
• A decrease of 25 basis points in the long-term rate of return would have increased our net
benefit cost by approximately $50 million;
• A decrease of 25 basis points in the discount rate would have increased our net benefit cost by
approximately $65 million; and
• An increase of 25 basis points in the future compensation rate would have increased our net
benefit cost by approximately $24 million.
Loss Contingencies
We are involved in various lawsuits, claims, investigations and proceedings that arise in the
ordinary course of business. We record a provision for a liability when we believe that it is both
probable that a liability has been incurred and the amount can be reasonably estimated. Significant
45