HP 2010 Annual Report Download - page 61
Download and view the complete annual report
Please find page 61 of the 2010 HP annual report below. You can navigate through the pages in the report by either clicking on the pages listed below, or by using the keyword search tool below to find specific information within the annual report.-
 1
1 -
2
-
3
-
4
-
5
-
6
-
7
-
8
-
9
-
10
-
11
-
12
-
13
-
14
-
15
-
16
-
17
-
18
-
19
-
20
-
21
-
22
-
23
-
24
-
25
-
26
-
27
-
28
-
29
-
30
-
31
-
32
-
33
-
34
-
35
-
36
-
37
-
38
-
39
-
40
-
41
-
42
-
43
-
44
-
45
-
46
-
47
-
48
-
49
-
50
-
 51
51 -
 52
52 -
 53
53 -
 54
54 -
 55
55 -
 56
56 -
 57
57 -
 58
58 -
 59
59 -
 60
60 -
 61
61 -
 62
62 -
 63
63 -
 64
64 -
 65
65 -
 66
66 -
 67
67 -
 68
68 -
 69
69 -
 70
70 -
 71
71 -
72
-
73
-
74
-
75
-
76
-
77
-
78
-
79
-
80
-
81
-
82
-
83
-
84
-
85
-
86
-
87
-
88
-
89
-
90
-
91
-
92
-
93
-
94
-
95
-
96
-
97
-
98
-
99
-
100
-
101
-
102
-
103
-
104
-
105
-
106
-
107
-
108
-
109
-
110
-
111
-
112
-
113
-
114
-
115
-
116
-
117
-
118
-
119
-
120
-
121
-
122
-
123
-
124
-
125
-
126
-
127
-
128
-
129
-
130
-
131
-
132
-
133
-
134
-
135
-
136
-
137
-
138
-
139
-
140
-
141
-
142
-
143
-
144
-
145
-
146
-
147
-
148
-
149
-
150
-
151
-
152
-
153
-
154
-
155
-
156
-
157
-
158
-
159
-
160
-
161
-
162
-
163
-
164
-
165
-
166
-
167
-
168
-
169
-
170
-
171
-
172
-
173
-
174
-
175
-
176
-
177
-
178
-
179
-
180
 |
 |

HEWLETT-PACKARD COMPANY AND SUBSIDIARIES
Management’s Discussion and Analysis of
Financial Condition and Results of Operations (Continued)
in technology services declined due primarily to unfavorable currency impacts and weak economic
conditions, the effect of which was partially offset by growth in extended warranty.
Services earnings from operations as a percentage of net revenue increased by 2.5 percentage
points in fiscal 2009. The operating margin increased due primarily to a decrease in operating expenses
as a percentage of revenue. There was also an increase in gross margin for fiscal 2009. Operating
expense declined as a result of a continued focus on cost structure improvements from overall cost
controls. The gross margin in our Services segment increased for fiscal 2009 from fiscal 2008 due
primarily to the continued focus on cost structure improvements, including delivery efficiencies and cost
controls in our technology services business, and EDS-related acquisition synergies. This was partially
offset by the mix effect from the acquisition of the EDS business, which has lower gross margins.
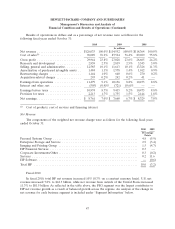
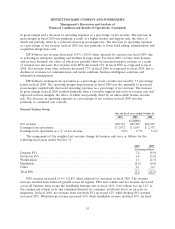
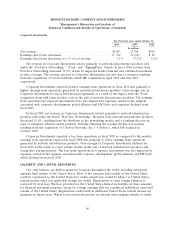
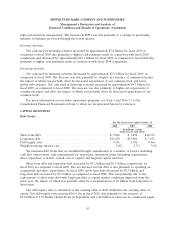
Enterprise Storage and Servers
For the fiscal years ended October 31
2010 2009 2008
In millions
Net revenue ........................................... $18,651 $15,359 $19,400
Earnings from operations ................................. $ 2,402 $ 1,518 $ 2,577
Earnings from operations as a % of net revenue ................ 12.9% 9.9% 13.3%
The components of the weighted net revenue change by business unit were as follows for the
following fiscal years ended October 31:
2010 2009
Percentage Points
Industry standard servers ............................................. 21.3 (12.1)
Storage .......................................................... 2.0 (3.8)
Business critical systems .............................................. (1.9) (4.9)
Total ESS ........................................................ 21.4 (20.8)
ESS net revenue increased 21.4% (18.9% when adjusted for currency) for fiscal 2010. ESS blades
revenue increased by 37% in fiscal 2010. ISS net revenue increased by 35% in fiscal 2010, driven
primarily by unit volume growth coupled with increased average unit prices due to improving market
conditions and demand for the latest generation of ISS products. Storage net revenue increased by 9%
in fiscal 2010, driven primarily by strong performance in products related to our acquisition of Lefthand
Networks, and growth in high-end disk products and storage networking products. Business critical
systems (‘‘BCS’’) net revenue decreased 12%, due primarily to market conditions and competitive
pressures, the effect of which was partially offset by new product introductions in the fourth quarter of
fiscal 2010.
ESS earnings from operations as a percentage of net revenue increased by 3.0 percentage points in
fiscal 2010, driven by decreases in operating expenses as a percentage of net revenue, the effect of
which was partially offset by declines in gross margin. Operating expenses as a percentage of net
revenue decreased as a result of operating leverage benefits from increased volume and cost controls.
The gross margin decline in fiscal 2010 was due primarily to a product mix shift resulting from the
strength in ISS, the effect of which was partially offset by lower product costs and strong volume.
53