HP 2010 Annual Report Download - page 71
Download and view the complete annual report
Please find page 71 of the 2010 HP annual report below. You can navigate through the pages in the report by either clicking on the pages listed below, or by using the keyword search tool below to find specific information within the annual report.-
 1
1 -
2
-
3
-
4
-
5
-
6
-
7
-
8
-
9
-
10
-
11
-
12
-
13
-
14
-
15
-
16
-
17
-
18
-
19
-
20
-
21
-
22
-
23
-
24
-
25
-
26
-
27
-
28
-
29
-
30
-
31
-
32
-
33
-
34
-
35
-
36
-
37
-
38
-
39
-
40
-
41
-
42
-
43
-
44
-
45
-
46
-
47
-
48
-
49
-
50
-
51
-
52
-
53
-
54
-
55
-
56
-
57
-
58
-
59
-
60
-
 61
61 -
 62
62 -
 63
63 -
 64
64 -
 65
65 -
 66
66 -
 67
67 -
 68
68 -
 69
69 -
 70
70 -
 71
71 -
 72
72 -
 73
73 -
 74
74 -
 75
75 -
 76
76 -
 77
77 -
 78
78 -
 79
79 -
 80
80 -
 81
81 -
82
-
83
-
84
-
85
-
86
-
87
-
88
-
89
-
90
-
91
-
92
-
93
-
94
-
95
-
96
-
97
-
98
-
99
-
100
-
101
-
102
-
103
-
104
-
105
-
106
-
107
-
108
-
109
-
110
-
111
-
112
-
113
-
114
-
115
-
116
-
117
-
118
-
119
-
120
-
121
-
122
-
123
-
124
-
125
-
126
-
127
-
128
-
129
-
130
-
131
-
132
-
133
-
134
-
135
-
136
-
137
-
138
-
139
-
140
-
141
-
142
-
143
-
144
-
145
-
146
-
147
-
148
-
149
-
150
-
151
-
152
-
153
-
154
-
155
-
156
-
157
-
158
-
159
-
160
-
161
-
162
-
163
-
164
-
165
-
166
-
167
-
168
-
169
-
170
-
171
-
172
-
173
-
174
-
175
-
176
-
177
-
178
-
179
-
180
 |
 |

HEWLETT-PACKARD COMPANY AND SUBSIDIARIES
Management’s Discussion and Analysis of
Financial Condition and Results of Operations (Continued)
improved inventory management. The increase in DPO was due primarily to a change in purchasing
linearity as business recovered through the fourth quarter.
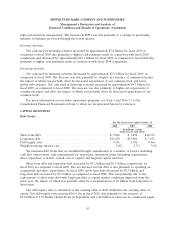
Investing Activities
Net cash used in investing activities increased by approximately $7.8 billion for fiscal 2010 as
compared to fiscal 2009 due primarily to higher cash payments made in connection with fiscal 2010
acquisitions and decreased by approximately $10.1 billion for fiscal 2009 as compared to fiscal 2008 due
primarily to higher cash payments made in connection with fiscal 2008 acquisitions.
Financing Activities
Net cash used in financing activities decreased by approximately $3.8 billion for fiscal 2010, as
compared to fiscal 2009. The decrease was due primarily to a higher net issuance of commercial paper,
the impact of which was partially offset by increased repurchases of our common stock and lower
global debt issuance. Net cash used in financing activities increased by approximately $4.7 billion for
fiscal 2009, as compared to fiscal 2008. The increase was due primarily to higher net repayments of
commercial paper and debt, the impact of which was partially offset by decreased repurchases of our
common stock.
For more information on our share repurchase programs, see Item 5 and Note 15 to the
Consolidated Financial Statements in Item 8, which are incorporated herein by reference.
CAPITAL RESOURCES
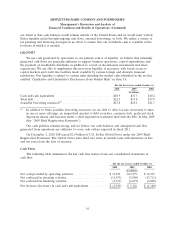
Debt Levels
For the fiscal years ended October 31
2010 2009 2008
In millions, except
interest rates and ratios
Short-term debt ..................................... $ 7,046 $ 1,850 $10,176
Long-term debt ..................................... $15,258 $13,980 $ 7,676
Debt-equity ratio .................................... 0.55x 0.39x 0.46x
Weighted-average interest rate .......................... 2.0% 2.7% 3.6%
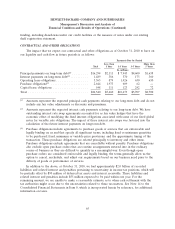
We maintain debt levels that we establish through consideration of a number of factors, including
cash flow expectations, cash requirements for operations, investment plans (including acquisitions),
share repurchase activities, overall cost of capital, and targeted capital structure.
Short-term debt and long-term debt increased by $5.2 billion and $1.3 billion, respectively, for
fiscal 2010 as compared to fiscal 2009. The net increase in total debt is due primarily to spending on
acquisitions and share repurchases. In fiscal 2009, short-term debt decreased by $8.3 billion and
long-term debt increased by $6.3 billion as compared to fiscal 2008. This was primarily due to the
replacement of short-term debt with long-term debt as capital market conditions improved from the
prior year, the impact of which was partially offset by a reclassification of $1 billion from long-term to
short-term.
Our debt-equity ratio is calculated as the carrying value of debt divided by the carrying value of
equity. Our debt-equity ratio increased by 0.16x in fiscal 2010, due primarily to the issuance of
$3.0 billion of U.S Dollar Global Notes in September and a $4 billion net increase in commercial paper
63