HP 2010 Annual Report Download - page 163
Download and view the complete annual report
Please find page 163 of the 2010 HP annual report below. You can navigate through the pages in the report by either clicking on the pages listed below, or by using the keyword search tool below to find specific information within the annual report.-
 1
1 -
2
-
3
-
4
-
5
-
6
-
7
-
8
-
9
-
10
-
11
-
12
-
13
-
14
-
15
-
16
-
17
-
18
-
19
-
20
-
21
-
22
-
23
-
24
-
25
-
26
-
27
-
28
-
29
-
30
-
31
-
32
-
33
-
34
-
35
-
36
-
37
-
38
-
39
-
40
-
41
-
42
-
43
-
44
-
45
-
46
-
47
-
48
-
49
-
50
-
51
-
52
-
53
-
54
-
55
-
56
-
57
-
58
-
59
-
60
-
61
-
62
-
63
-
64
-
65
-
66
-
67
-
68
-
69
-
70
-
71
-
72
-
73
-
74
-
75
-
76
-
77
-
78
-
79
-
80
-
81
-
82
-
83
-
84
-
85
-
86
-
87
-
88
-
89
-
90
-
91
-
92
-
93
-
94
-
95
-
96
-
97
-
98
-
99
-
100
-
101
-
102
-
103
-
104
-
105
-
106
-
107
-
108
-
109
-
110
-
111
-
112
-
113
-
114
-
115
-
116
-
117
-
118
-
119
-
120
-
121
-
122
-
123
-
124
-
125
-
126
-
127
-
128
-
129
-
130
-
131
-
132
-
133
-
134
-
135
-
136
-
137
-
138
-
139
-
140
-
141
-
142
-
143
-
144
-
145
-
146
-
147
-
148
-
149
-
150
-
151
-
152
-
 153
153 -
 154
154 -
 155
155 -
 156
156 -
 157
157 -
 158
158 -
 159
159 -
 160
160 -
 161
161 -
 162
162 -
 163
163 -
 164
164 -
 165
165 -
 166
166 -
 167
167 -
 168
168 -
 169
169 -
 170
170 -
 171
171 -
 172
172 -
 173
173 -
174
-
175
-
176
-
177
-
178
-
179
-
180
 |
 |

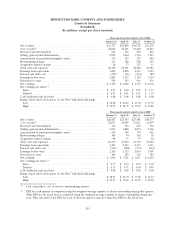
HEWLETT-PACKARD COMPANY AND SUBSIDIARIES
Quarterly Summary
(Unaudited)
(In millions, except per share amounts)
Three-month periods ended in fiscal 2010
January 31 April 30 July 31 October 31
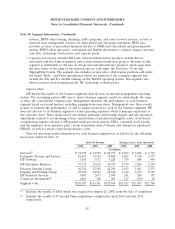
Net revenue ........................................ $31,177 $30,849 $30,729 $33,278
Cost of sales(1) ....................................... 24,062 23,601 23,402 25,024
Research and development .............................. 681 722 742 814
Selling, general and administrative ......................... 2,932 3,064 3,154 3,435
Amortization of purchased intangible assets ................... 330 347 383 424
Restructuring charges .................................. 131 180 598 235
Acquisition-related charges .............................. 38 77 127 51
Total costs and expenses ................................ 28,174 27,991 28,406 29,983
Earnings from operations ............................... 3,003 2,858 2,323 3,295
Interest and other, net ................................. (199) (91) (134) (81)
Earnings before taxes .................................. 2,804 2,767 2,189 3,214
Provision for taxes .................................... 554 567 416 676
Net earnings ........................................ $2,250 $ 2,200 $ 1,773 $ 2,538
Net earnings per share:(2)
Basic ............................................ $ 0.95 $ 0.94 $ 0.76 $ 1.13
Diluted .......................................... $ 0.93 $ 0.91 $ 0.75 $ 1.10
Cash dividends paid per share ............................ $ 0.08 $ 0.08 $ 0.08 $ 0.08
Range of per share stock prices on the New York Stock Exchange
Low ............................................ $46.80 $ 46.46 $ 41.94 $ 37.32
High ............................................ $52.95 $ 54.75 $ 52.95 $ 47.80
Three-month periods ended in fiscal 2009
January 31 April 30 July 31 October 31
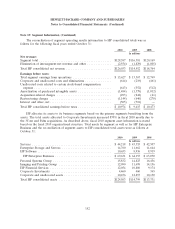
Net revenue ........................................ $28,807 $27,383 $27,585 $30,777
Cost of sales(1) ....................................... 22,073 20,945 21,031 23,475
Research and development .............................. 732 716 667 704
Selling, general and administrative ......................... 2,893 2,880 2,874 2,966
Amortization of purchased intangible assets ................... 418 380 379 401
Restructuring charges .................................. 146 94 362 38
Acquisition-related charges .............................. 48 75 59 60
Total costs and expenses ................................ 26,310 25,090 25,372 27,644
Earnings from operations ............................... 2,497 2,293 2,213 3,133
Interest and other, net ................................. (232) (180) (177) (132)
Earnings before taxes .................................. 2,265 2,113 2,036 3,001
Provision for taxes .................................... 409 392 365 589
Net earnings ........................................ $1,856 $ 1,721 $ 1,671 $ 2,412
Net earnings per share:(2)
Basic ............................................ $ 0.77 $ 0.72 $ 0.70 $ 1.02
Diluted .......................................... $ 0.75 $ 0.71 $ 0.69 $ 0.99
Cash dividends paid per share ............................ $ 0.08 $ 0.08 $ 0.08 $ 0.08
Range of per share stock prices on the New York Stock Exchange
Low ............................................ $28.23 $ 25.39 $ 33.40 $ 42.14
High ............................................ $39.53 $ 37.40 $ 43.55 $ 49.20
(1) Cost of products, cost of services and financing interest.
(2) EPS for each quarter is computed using the weighted-average number of shares outstanding during that quarter,
while EPS for the fiscal year is computed using the weighted-average number of shares outstanding during the
year. Thus, the sum of the EPS for each of the four quarters may not equal the EPS for the fiscal year.
155