HP 2010 Annual Report Download - page 70
Download and view the complete annual report
Please find page 70 of the 2010 HP annual report below. You can navigate through the pages in the report by either clicking on the pages listed below, or by using the keyword search tool below to find specific information within the annual report.-
 1
1 -
2
-
3
-
4
-
5
-
6
-
7
-
8
-
9
-
10
-
11
-
12
-
13
-
14
-
15
-
16
-
17
-
18
-
19
-
20
-
21
-
22
-
23
-
24
-
25
-
26
-
27
-
28
-
29
-
30
-
31
-
32
-
33
-
34
-
35
-
36
-
37
-
38
-
39
-
40
-
41
-
42
-
43
-
44
-
45
-
46
-
47
-
48
-
49
-
50
-
51
-
52
-
53
-
54
-
55
-
56
-
57
-
58
-
59
-
 60
60 -
 61
61 -
 62
62 -
 63
63 -
 64
64 -
 65
65 -
 66
66 -
 67
67 -
 68
68 -
 69
69 -
 70
70 -
 71
71 -
 72
72 -
 73
73 -
 74
74 -
 75
75 -
 76
76 -
 77
77 -
 78
78 -
 79
79 -
 80
80 -
81
-
82
-
83
-
84
-
85
-
86
-
87
-
88
-
89
-
90
-
91
-
92
-
93
-
94
-
95
-
96
-
97
-
98
-
99
-
100
-
101
-
102
-
103
-
104
-
105
-
106
-
107
-
108
-
109
-
110
-
111
-
112
-
113
-
114
-
115
-
116
-
117
-
118
-
119
-
120
-
121
-
122
-
123
-
124
-
125
-
126
-
127
-
128
-
129
-
130
-
131
-
132
-
133
-
134
-
135
-
136
-
137
-
138
-
139
-
140
-
141
-
142
-
143
-
144
-
145
-
146
-
147
-
148
-
149
-
150
-
151
-
152
-
153
-
154
-
155
-
156
-
157
-
158
-
159
-
160
-
161
-
162
-
163
-
164
-
165
-
166
-
167
-
168
-
169
-
170
-
171
-
172
-
173
-
174
-
175
-
176
-
177
-
178
-
179
-
180
 |
 |

HEWLETT-PACKARD COMPANY AND SUBSIDIARIES
Management’s Discussion and Analysis of
Financial Condition and Results of Operations (Continued)
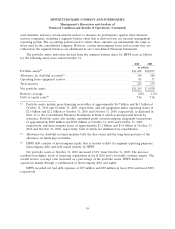
Operating Activities
Net cash provided by operating activities decreased by approximately $1.5 billion for fiscal 2010, as
compared to fiscal 2009. The decrease was due primarily to an increase in accounts and financing
receivables resulting from higher revenues in the fourth quarter and higher payments for account
payable activities, the impact of which was partially offset by the increase in net earnings. Net cash
provided by operating activities decreased by approximately $1.2 billion for fiscal 2009, as compared to
fiscal 2008. The decrease was due primarily to increased utilization of cash resources for payment of
operating liabilities such as accounts payable, other current liabilities and restructuring along with a
decrease in net earnings, the impact of which was partially offset by the increased generation of cash
resources through the utilization of operating assets such as inventory and other current assets along
with increased amortization expense.
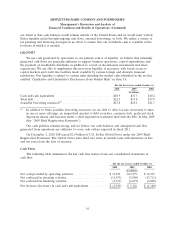
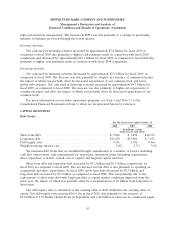
Our key working capital metrics are as follows:
October 31
2010 2009 2008
Days of sales outstanding in accounts receivable ........................... 50 48 45
Days of supply in inventory .......................................... 23 23 27
Days of purchases outstanding in accounts payable ......................... (52) (57) (52)
Cash conversion cycle .............................................. 21 14 20
Days of sales outstanding in accounts receivable (‘‘DSO’’) measures the average number of days
our receivables are outstanding. DSO is calculated by dividing ending accounts receivable, net of
allowance for doubtful accounts, by a 90-day average net revenue. Our accounts receivable balance was
$18.5 billion as of October 31, 2010.
Days of supply in inventory (‘‘DOS’’) measures the average number of days from procurement to
sale of our product. DOS is calculated by dividing ending inventory by a 90-day average cost of goods
sold. Our inventory balance was $6.5 billion as of October 31, 2010.
Days of purchases outstanding in accounts payable (‘‘DPO’’) measures the average number of days
our accounts payable balances are outstanding. DPO is calculated by dividing ending accounts payable
by a 90-day average cost of goods sold. Our accounts payable balance was $14.4 billion as of
October 31, 2010.
Our working capital requirements depend upon our effective management of the cash conversion
cycle, which represents effectively the number of days that elapse from the day we pay for the purchase
of raw materials to the collection of cash from our customers. The cash conversion cycle is the sum of
DSO and DOS less DPO.
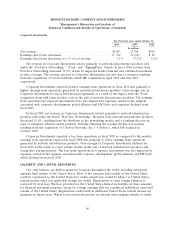
The cash conversion cycle for fiscal 2010 increased by 7 days as compared to fiscal 2009. The
increase in DSO was due primarily to linearity and fewer cash discounts in the fourth quarter. DOS
remained flat year over year. The decrease in DPO was due primarily to a change in purchasing
linearity in the fourth quarter.
The cash conversion cycle for fiscal 2009 decreased by 6 days as compared to fiscal 2008. The
increase in DSO was due primarily to our improving penetration into the enterprise market which
tends to have a higher DSO profile, optimizing terms to drive shareholder value as well as more sales
in the month of October. The decrease in DOS was due to lower inventory levels driven primarily by
62