HP 2010 Annual Report Download - page 97
Download and view the complete annual report
Please find page 97 of the 2010 HP annual report below. You can navigate through the pages in the report by either clicking on the pages listed below, or by using the keyword search tool below to find specific information within the annual report.-
 1
1 -
2
-
3
-
4
-
5
-
6
-
7
-
8
-
9
-
10
-
11
-
12
-
13
-
14
-
15
-
16
-
17
-
18
-
19
-
20
-
21
-
22
-
23
-
24
-
25
-
26
-
27
-
28
-
29
-
30
-
31
-
32
-
33
-
34
-
35
-
36
-
37
-
38
-
39
-
40
-
41
-
42
-
43
-
44
-
45
-
46
-
47
-
48
-
49
-
50
-
51
-
52
-
53
-
54
-
55
-
56
-
57
-
58
-
59
-
60
-
61
-
62
-
63
-
64
-
65
-
66
-
67
-
68
-
69
-
70
-
71
-
72
-
73
-
74
-
75
-
76
-
77
-
78
-
79
-
80
-
81
-
82
-
83
-
84
-
85
-
86
-
 87
87 -
 88
88 -
 89
89 -
 90
90 -
 91
91 -
 92
92 -
 93
93 -
 94
94 -
 95
95 -
 96
96 -
 97
97 -
 98
98 -
 99
99 -
 100
100 -
 101
101 -
 102
102 -
 103
103 -
 104
104 -
 105
105 -
 106
106 -
 107
107 -
108
-
109
-
110
-
111
-
112
-
113
-
114
-
115
-
116
-
117
-
118
-
119
-
120
-
121
-
122
-
123
-
124
-
125
-
126
-
127
-
128
-
129
-
130
-
131
-
132
-
133
-
134
-
135
-
136
-
137
-
138
-
139
-
140
-
141
-
142
-
143
-
144
-
145
-
146
-
147
-
148
-
149
-
150
-
151
-
152
-
153
-
154
-
155
-
156
-
157
-
158
-
159
-
160
-
161
-
162
-
163
-
164
-
165
-
166
-
167
-
168
-
169
-
170
-
171
-
172
-
173
-
174
-
175
-
176
-
177
-
178
-
179
-
180
 |
 |

HEWLETT-PACKARD COMPANY AND SUBSIDIARIES
Notes to Consolidated Financial Statements (Continued)
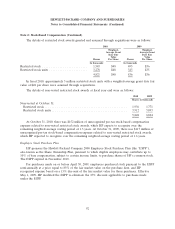
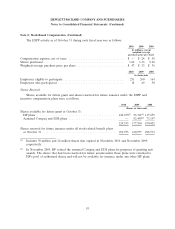
Note 2: Stock-Based Compensation (Continued)
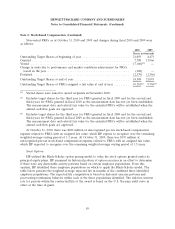
Non-vested PRUs as of October 31, 2010 and 2009 and changes during fiscal 2010 and 2009 were
as follows:
2010 2009
Shares in thousands
Outstanding Target Shares at beginning of year ........................... 21,093 8,473
Granted ....................................................... 7,388 13,966
Vested ........................................................ (7,186)(1) —
Change in units due to performance and market conditions achievement for PRUs
vested in the year ............................................... (108) —
Forfeited ....................................................... (2,679) (1,346)
Outstanding Target Shares at end of year ............................... 18,508 21,093
Outstanding Target Shares of PRUs assigned a fair value at end of year ......... 10,201(2) 9,796(3)
(1) Vested shares were issued to award recipients in November 2010.
(2) Excludes target shares for the third year for PRUs granted in fiscal 2009 and for the second and
third years for PRUs granted in fiscal 2010 as the measurement date has not yet been established.
The measurement date and related fair value for the excluded PRUs will be established when the
annual cash flow goals are approved.
(3) Excludes target shares for the third year for PRUs granted in fiscal 2008 and for the second and
third years for PRUs granted in fiscal 2009 as the measurement date has not yet been established.
The measurement date and related fair value for the excluded PRUs will be established when the
annual cash flow goals are approved.
At October 31, 2010, there was $222 million of unrecognized pre-tax stock-based compensation
expense related to PRUs with an assigned fair value, which HP expects to recognize over the remaining
weighted-average vesting period of 1.2 years. At October 31, 2009, there was $193 million of
unrecognized pre-tax stock-based compensation expense related to PRUs with an assigned fair value,
which HP expected to recognize over the remaining weighted-average vesting period of 1.5 years.
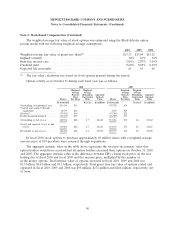
Stock Options
HP utilized the Black-Scholes option pricing model to value the stock options granted under its
principal equity plans. HP examined its historical pattern of option exercises in an effort to determine
if there were any discernable activity patterns based on certain employee populations. From this
analysis, HP identified three employee populations on which to apply the Black-Scholes model. The
table below presents the weighted-average expected life in months of the combined three identified
employee populations. The expected life computation is based on historical exercise patterns and
post-vesting termination behavior within each of the three populations identified. The risk-free interest
rate for periods within the contractual life of the award is based on the U.S. Treasury yield curve in
effect at the time of grant.
89