HP 2010 Annual Report Download - page 83
Download and view the complete annual report
Please find page 83 of the 2010 HP annual report below. You can navigate through the pages in the report by either clicking on the pages listed below, or by using the keyword search tool below to find specific information within the annual report.-
 1
1 -
2
-
3
-
4
-
5
-
6
-
7
-
8
-
9
-
10
-
11
-
12
-
13
-
14
-
15
-
16
-
17
-
18
-
19
-
20
-
21
-
22
-
23
-
24
-
25
-
26
-
27
-
28
-
29
-
30
-
31
-
32
-
33
-
34
-
35
-
36
-
37
-
38
-
39
-
40
-
41
-
42
-
43
-
44
-
45
-
46
-
47
-
48
-
49
-
50
-
51
-
52
-
53
-
54
-
55
-
56
-
57
-
58
-
59
-
60
-
61
-
62
-
63
-
64
-
65
-
66
-
67
-
68
-
69
-
70
-
71
-
72
-
 73
73 -
 74
74 -
 75
75 -
 76
76 -
 77
77 -
 78
78 -
 79
79 -
 80
80 -
 81
81 -
 82
82 -
 83
83 -
 84
84 -
 85
85 -
 86
86 -
 87
87 -
 88
88 -
 89
89 -
 90
90 -
 91
91 -
 92
92 -
 93
93 -
94
-
95
-
96
-
97
-
98
-
99
-
100
-
101
-
102
-
103
-
104
-
105
-
106
-
107
-
108
-
109
-
110
-
111
-
112
-
113
-
114
-
115
-
116
-
117
-
118
-
119
-
120
-
121
-
122
-
123
-
124
-
125
-
126
-
127
-
128
-
129
-
130
-
131
-
132
-
133
-
134
-
135
-
136
-
137
-
138
-
139
-
140
-
141
-
142
-
143
-
144
-
145
-
146
-
147
-
148
-
149
-
150
-
151
-
152
-
153
-
154
-
155
-
156
-
157
-
158
-
159
-
160
-
161
-
162
-
163
-
164
-
165
-
166
-
167
-
168
-
169
-
170
-
171
-
172
-
173
-
174
-
175
-
176
-
177
-
178
-
179
-
180
 |
 |

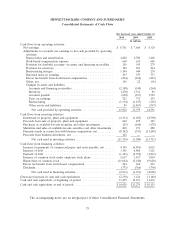
HEWLETT-PACKARD COMPANY AND SUBSIDIARIES
Consolidated Statements of Cash Flows
For the fiscal years ended October 31
2010 2009 2008
In millions
Cash flows from operating activities:
Net earnings ........................................... $ 8,761 $ 7,660 $ 8,329
Adjustments to reconcile net earnings to net cash provided by operating
activities:
Depreciation and amortization ............................ 4,820 4,780 3,401
Stock-based compensation expense ......................... 668 635 606
Provision for doubtful accounts—accounts and financing receivables . . 156 345 275
Provision for inventory .................................. 189 221 214
Restructuring charges ................................... 1,144 640 270
Deferred taxes on earnings ............................... 197 379 773
Excess tax benefit from stock-based compensation ............... (294) (162) (293)
Other, net ........................................... 169 22 (61)
Changes in assets and liabilities:
Accounts and financing receivables ........................ (2,398) (549) (264)
Inventory .......................................... (270) 1,532 89
Accounts payable .................................... (698) (153) 1,749
Taxes on earnings .................................... 723 733 235
Restructuring ....................................... (1,334) (1,237) (165)
Other assets and liabilities .............................. 89 (1,467) (567)
Net cash provided by operating activities .................. 11,922 13,379 14,591
Cash flows from investing activities:
Investment in property, plant and equipment .................... (4,133) (3,695) (2,990)
Proceeds from sale of property, plant and equipment .............. 602 495 425
Purchases of available-for-sale securities and other investments ....... (51) (160) (178)
Maturities and sales of available-for-sale securities and other investments . 200 171 280
Payments made in connection with business acquisitions, net ......... (8,102) (391) (11,248)
Proceeds from business divestiture, net ........................ 125 — —
Net cash used in investing activities ...................... (11,359) (3,580) (13,711)
Cash flows from financing activities:
Issuance (repayment) of commercial paper and notes payable, net ..... 4,156 (6,856) 5,015
Issuance of debt ........................................ 3,156 6,800 3,121
Payment of debt ........................................ (1,323) (2,710) (1,843)
Issuance of common stock under employee stock plans ............. 2,617 1,837 1,810
Repurchase of common stock ............................... (11,042) (5,140) (9,620)
Excess tax benefit from stock-based compensation ................ 294 162 293
Dividends ............................................. (771) (766) (796)
Net cash used in financing activities ..................... (2,913) (6,673) (2,020)
(Decrease) increase in cash and cash equivalents ................... (2,350) 3,126 (1,140)
Cash and cash equivalents at beginning of period .................. 13,279 10,153 11,293
Cash and cash equivalents at end of period ....................... $10,929 $13,279 $ 10,153
The accompanying notes are an integral part of these Consolidated Financial Statements.
75