HP 2010 Annual Report Download - page 179
Download and view the complete annual report
Please find page 179 of the 2010 HP annual report below. You can navigate through the pages in the report by either clicking on the pages listed below, or by using the keyword search tool below to find specific information within the annual report.-
 1
1 -
2
-
3
-
4
-
5
-
6
-
7
-
8
-
9
-
10
-
11
-
12
-
13
-
14
-
15
-
16
-
17
-
18
-
19
-
20
-
21
-
22
-
23
-
24
-
25
-
26
-
27
-
28
-
29
-
30
-
31
-
32
-
33
-
34
-
35
-
36
-
37
-
38
-
39
-
40
-
41
-
42
-
43
-
44
-
45
-
46
-
47
-
48
-
49
-
50
-
51
-
52
-
53
-
54
-
55
-
56
-
57
-
58
-
59
-
60
-
61
-
62
-
63
-
64
-
65
-
66
-
67
-
68
-
69
-
70
-
71
-
72
-
73
-
74
-
75
-
76
-
77
-
78
-
79
-
80
-
81
-
82
-
83
-
84
-
85
-
86
-
87
-
88
-
89
-
90
-
91
-
92
-
93
-
94
-
95
-
96
-
97
-
98
-
99
-
100
-
101
-
102
-
103
-
104
-
105
-
106
-
107
-
108
-
109
-
110
-
111
-
112
-
113
-
114
-
115
-
116
-
117
-
118
-
119
-
120
-
121
-
122
-
123
-
124
-
125
-
126
-
127
-
128
-
129
-
130
-
131
-
132
-
133
-
134
-
135
-
136
-
137
-
138
-
139
-
140
-
141
-
142
-
143
-
144
-
145
-
146
-
147
-
148
-
149
-
150
-
151
-
152
-
153
-
154
-
155
-
156
-
157
-
158
-
159
-
160
-
161
-
162
-
163
-
164
-
165
-
166
-
167
-
168
-
 169
169 -
 170
170 -
 171
171 -
 172
172 -
 173
173 -
 174
174 -
 175
175 -
 176
176 -
 177
177 -
 178
178 -
 179
179 -
 180
180
 |
 |
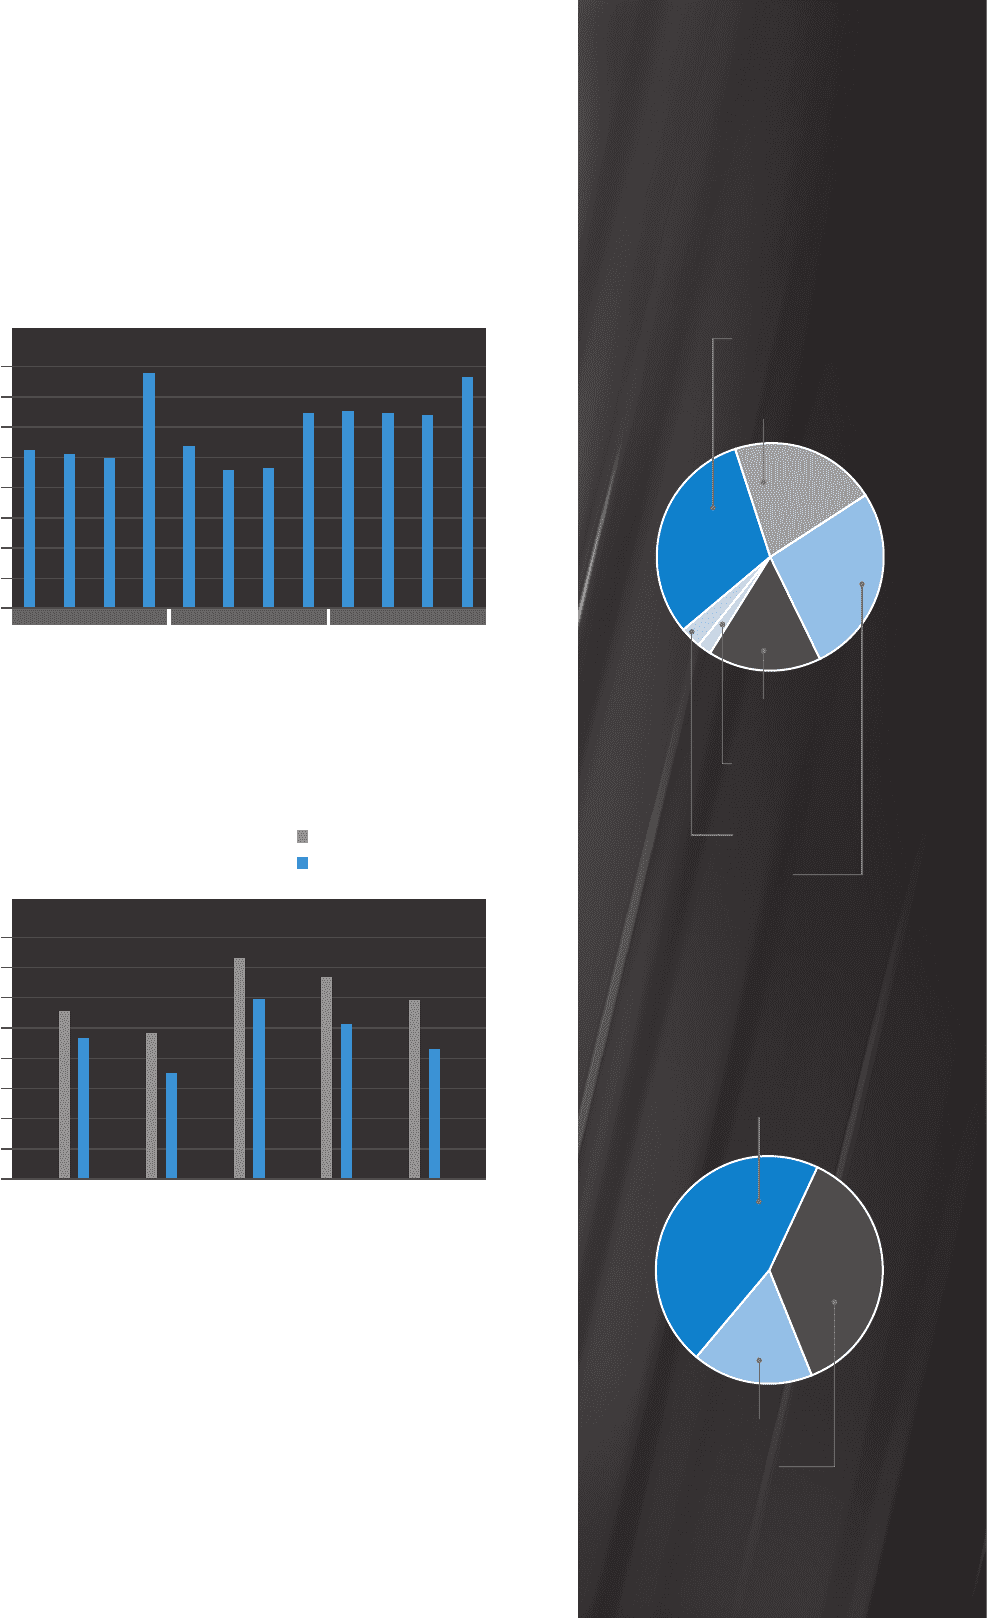
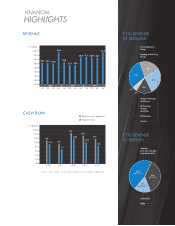
FINANCIAL
HIGHLIGHTS
FY10 REVENUE
BY SEGMENT
FY10 REVENUE
BY REGION
$ in billions
$34.0
32.0
30.0
28.0
26.0
24.0
22.0
20.0
18.0
$ in billions
$16.0
14.0
12.0
10.0
8.0
6.0
4.0
2.0
0.0
1Q 1Q 1Q2Q 2Q 2Q3Q 3Q 3Q4Q 4Q 4Q
28.528.3 28.0
33.6
28.8
27.4 27.6
30.8 31.2 30.8 30.7
33.3
2008 2009 2010
FY06 FY07 FY08 FY09 FY10
11.4
9.6
14.6
13.4
11.9
9.4
7.1
12.0
10.2
8.4
Personal Systems
Group
Imaging and Printing
Group
Enterprise Storage
and Servers
HP Financial
Services
and Other
HP Software
Services
Asia Pacific
EMEA
Americas
(U.S. 35%, Canada/
Latin America 9%)
Cash flow from operations
Free cash flow1
1 Free cash flow equals cash flow from operations less net capital expenditures.
REVENUE
CASH FLOW
32%
20%
28%
15%
3%
44%
(up 11% Y/Y)
38%
(up 7% Y/Y)
18%
(up 16% Y/Y)
2%