HP 2010 Annual Report Download - page 65
Download and view the complete annual report
Please find page 65 of the 2010 HP annual report below. You can navigate through the pages in the report by either clicking on the pages listed below, or by using the keyword search tool below to find specific information within the annual report.-
 1
1 -
2
-
3
-
4
-
5
-
6
-
7
-
8
-
9
-
10
-
11
-
12
-
13
-
14
-
15
-
16
-
17
-
18
-
19
-
20
-
21
-
22
-
23
-
24
-
25
-
26
-
27
-
28
-
29
-
30
-
31
-
32
-
33
-
34
-
35
-
36
-
37
-
38
-
39
-
40
-
41
-
42
-
43
-
44
-
45
-
46
-
47
-
48
-
49
-
50
-
51
-
52
-
53
-
54
-
 55
55 -
 56
56 -
 57
57 -
 58
58 -
 59
59 -
 60
60 -
 61
61 -
 62
62 -
 63
63 -
 64
64 -
 65
65 -
 66
66 -
 67
67 -
 68
68 -
 69
69 -
 70
70 -
 71
71 -
 72
72 -
 73
73 -
 74
74 -
 75
75 -
76
-
77
-
78
-
79
-
80
-
81
-
82
-
83
-
84
-
85
-
86
-
87
-
88
-
89
-
90
-
91
-
92
-
93
-
94
-
95
-
96
-
97
-
98
-
99
-
100
-
101
-
102
-
103
-
104
-
105
-
106
-
107
-
108
-
109
-
110
-
111
-
112
-
113
-
114
-
115
-
116
-
117
-
118
-
119
-
120
-
121
-
122
-
123
-
124
-
125
-
126
-
127
-
128
-
129
-
130
-
131
-
132
-
133
-
134
-
135
-
136
-
137
-
138
-
139
-
140
-
141
-
142
-
143
-
144
-
145
-
146
-
147
-
148
-
149
-
150
-
151
-
152
-
153
-
154
-
155
-
156
-
157
-
158
-
159
-
160
-
161
-
162
-
163
-
164
-
165
-
166
-
167
-
168
-
169
-
170
-
171
-
172
-
173
-
174
-
175
-
176
-
177
-
178
-
179
-
180
 |
 |

HEWLETT-PACKARD COMPANY AND SUBSIDIARIES
Management’s Discussion and Analysis of
Financial Condition and Results of Operations (Continued)
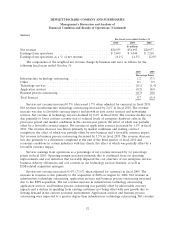
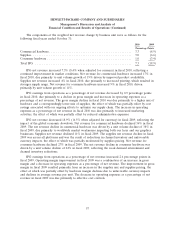
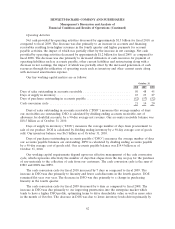
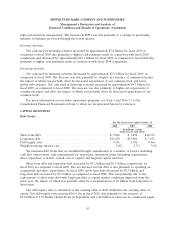
The components of the weighted net revenue change by business unit were as follows for the
following fiscal years ended October 31:
2010 2009
Percentage Points
Commercial hardware ............................................... 3.3 (8.9)
Supplies ......................................................... 3.0 (6.6)
Consumer hardware ................................................ 1.0 (3.4)
Total IPG ....................................................... 7.3 (18.9)
IPG net revenue increased 7.3% (8.4% when adjusted for currency) in fiscal 2010, reflecting a
continued improvement in market conditions. Net revenue for commercial hardware increased 17% in
fiscal 2010, due primarily to unit volume growth of 19% driven by improved product availability.
Supplies net revenue increased 4% in fiscal 2010, due primarily to increased printing, which resulted in
stronger supply usage. Net revenue for consumer hardware increased 9% in fiscal 2010, driven
primarily by unit volume growth of 11%.
IPG earnings from operations as a percentage of net revenue decreased by 0.9 percentage points
in fiscal 2010, due primarily to a decline in gross margin and increases in operating expenses as a
percentage of net revenue. The gross margin decline in fiscal 2010 was due primarily to a higher mix of
hardware and a correspondingly lower mix of supplies, the effect of which was partially offset by cost
savings associated with our ongoing efforts to optimize our supply chain. The increase in operating
expenses as a percentage of net revenue in fiscal 2010 was due primarily to increased marketing
activities, the effect of which was partially offset by reduced administrative expenses.
IPG net revenue decreased 18.9% (16.5% when adjusted for currency) in fiscal 2009, reflecting the
impact of the global economic slowdown. Net revenue for commercial hardware declined 36% in fiscal
2009. The net revenue decline in commercial hardware was driven by a unit volume decline of 38% in
fiscal 2009, due primarily to worldwide market weaknesses impacting both our laser and our graphics
businesses. Supplies net revenue declined 11% in fiscal 2009. The supplies net revenue decline in fiscal
2009 was across all platforms and was the result of reductions in channel inventory and unfavorable
currency impacts, the effect of which was partially moderated by supplies pricing. Net revenue for
consumer hardware declined 27% in fiscal 2009. The net revenue decline in consumer hardware was
driven by a unit volume decline of 24% in fiscal 2009, reflecting the weak demand environment and
channel inventory reductions.
IPG earnings from operations as a percentage of net revenue increased 2.6 percentage points in
fiscal 2009. Operating margin improvement in fiscal 2009 was a combination of an increase in gross
margin and a decrease in operating expenses as a percentage of net revenue. The improvement in gross
margin in fiscal 2009 resulted primarily from an increase in the supplies mix and supplies pricing, the
effect of which was partially offset by hardware margin declines due to unfavorable currency impacts
and declines in average revenue per unit. The decrease in operating expenses as a percentage of net
revenue in fiscal 2009 was due primarily to effective cost controls.
57