HP 2010 Annual Report Download - page 64
Download and view the complete annual report
Please find page 64 of the 2010 HP annual report below. You can navigate through the pages in the report by either clicking on the pages listed below, or by using the keyword search tool below to find specific information within the annual report.-
 1
1 -
2
-
3
-
4
-
5
-
6
-
7
-
8
-
9
-
10
-
11
-
12
-
13
-
14
-
15
-
16
-
17
-
18
-
19
-
20
-
21
-
22
-
23
-
24
-
25
-
26
-
27
-
28
-
29
-
30
-
31
-
32
-
33
-
34
-
35
-
36
-
37
-
38
-
39
-
40
-
41
-
42
-
43
-
44
-
45
-
46
-
47
-
48
-
49
-
50
-
51
-
52
-
53
-
 54
54 -
 55
55 -
 56
56 -
 57
57 -
 58
58 -
 59
59 -
 60
60 -
 61
61 -
 62
62 -
 63
63 -
 64
64 -
 65
65 -
 66
66 -
 67
67 -
 68
68 -
 69
69 -
 70
70 -
 71
71 -
 72
72 -
 73
73 -
 74
74 -
75
-
76
-
77
-
78
-
79
-
80
-
81
-
82
-
83
-
84
-
85
-
86
-
87
-
88
-
89
-
90
-
91
-
92
-
93
-
94
-
95
-
96
-
97
-
98
-
99
-
100
-
101
-
102
-
103
-
104
-
105
-
106
-
107
-
108
-
109
-
110
-
111
-
112
-
113
-
114
-
115
-
116
-
117
-
118
-
119
-
120
-
121
-
122
-
123
-
124
-
125
-
126
-
127
-
128
-
129
-
130
-
131
-
132
-
133
-
134
-
135
-
136
-
137
-
138
-
139
-
140
-
141
-
142
-
143
-
144
-
145
-
146
-
147
-
148
-
149
-
150
-
151
-
152
-
153
-
154
-
155
-
156
-
157
-
158
-
159
-
160
-
161
-
162
-
163
-
164
-
165
-
166
-
167
-
168
-
169
-
170
-
171
-
172
-
173
-
174
-
175
-
176
-
177
-
178
-
179
-
180
 |
 |

HEWLETT-PACKARD COMPANY AND SUBSIDIARIES
Management’s Discussion and Analysis of
Financial Condition and Results of Operations (Continued)
2010, net revenue for consumer clients increased 12% while commercial client revenue increased 20%.
Net revenue in Other increased 6% due primarily to increased sales of calculators, home servers and
warranty extensions. For fiscal 2010, the favorable impact on PSG net revenue from unit increases was
accompanied by a 1% increase in ASPs.
PSG earnings from operations as a percentage of net revenue increased 0.3 percentage points in
fiscal 2010. The increase was driven by improvements in operating expenses as a percentage of net
revenue, the effect of which was offset partially by a slight decline in gross margins. The decrease in
operating expenses as a percentage of net revenue was due to effective cost controls and operating
leverage benefits from increased volume. The decrease in gross margins was a result of higher
component costs, the effect of which was partially offset by lower warranty and logistics expenses.
PSG net revenue decreased 16.5% (11.6% when adjusted for currency) in fiscal 2009. The revenue
decline was primarily the result of the overall slowdown in the global economy. Despite the overall
regional declines, revenue in China increased for fiscal 2009. PSG net revenue decreased across all
businesses in fiscal 2009. Unit volume increased slightly in fiscal 2009, as an increase in notebook PC
volume was offset by a decline in desktop PCs, workstations, and handheld devices. The unit volume
increase in notebook PCs was due in part to growth of the HP and Compaq mini notebooks. In fiscal
2009, net revenue for notebook PCs decreased 11%, while net revenue for desktop PCs decreased 23%.
Workstations and handheld revenues declined 33% and 52%, respectively, in fiscal 2009. In fiscal 2009,
net revenue for consumer clients decreased 14%, while net revenue for commercial clients decreased
19%. The net revenue increase in Other PSG was related primarily to increased sales of extended
warranties, support services and third-party branded options. In fiscal 2009, PSG net revenue was also
impacted by ASP declines. ASPs in consumer clients declined 21%, while ASPs in commercial clients
declined 16%. ASPs declined due primarily to a competitive pricing environment, component cost
reductions and the impact of currency combined with a mix shift toward lower-end models. The ASP
decline in fiscal 2009 was offset slightly by an increase in the option and monitor attach rates.
PSG earnings from operations as a percentage of net revenue decreased by 0.9 percentage points
in fiscal 2009. The decrease was due primarily to a gross margin decline resulting from ASPs declining
at a faster pace than component costs combined with a mix shift toward lower-end products, the effects
of which were partially offset by lower warranty and supply chain costs and improvements in the option
attach rate. The decrease in operating expenses as a percentage of net revenue in fiscal 2009 was the
result of effective cost controls.
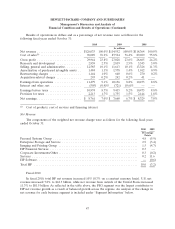
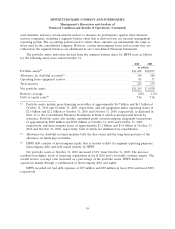
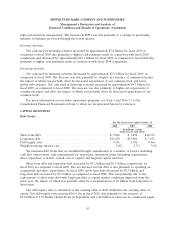
Imaging and Printing Group
For the fiscal years ended October 31
2010 2009 2008
In millions
Net revenue ........................................... $25,764 $24,011 $29,614
Earnings from operations ................................. $ 4,412 $ 4,310 $ 4,559
Earnings from operations as a % of net revenue ................ 17.1% 18.0% 15.4%
56