HP 2010 Annual Report Download - page 43
Download and view the complete annual report
Please find page 43 of the 2010 HP annual report below. You can navigate through the pages in the report by either clicking on the pages listed below, or by using the keyword search tool below to find specific information within the annual report.-
 1
1 -
2
-
3
-
4
-
5
-
6
-
7
-
8
-
9
-
10
-
11
-
12
-
13
-
14
-
15
-
16
-
17
-
18
-
19
-
20
-
21
-
22
-
23
-
24
-
25
-
26
-
27
-
28
-
29
-
30
-
31
-
32
-
 33
33 -
 34
34 -
 35
35 -
 36
36 -
 37
37 -
 38
38 -
 39
39 -
 40
40 -
 41
41 -
 42
42 -
 43
43 -
 44
44 -
 45
45 -
 46
46 -
 47
47 -
 48
48 -
 49
49 -
 50
50 -
 51
51 -
 52
52 -
 53
53 -
54
-
55
-
56
-
57
-
58
-
59
-
60
-
61
-
62
-
63
-
64
-
65
-
66
-
67
-
68
-
69
-
70
-
71
-
72
-
73
-
74
-
75
-
76
-
77
-
78
-
79
-
80
-
81
-
82
-
83
-
84
-
85
-
86
-
87
-
88
-
89
-
90
-
91
-
92
-
93
-
94
-
95
-
96
-
97
-
98
-
99
-
100
-
101
-
102
-
103
-
104
-
105
-
106
-
107
-
108
-
109
-
110
-
111
-
112
-
113
-
114
-
115
-
116
-
117
-
118
-
119
-
120
-
121
-
122
-
123
-
124
-
125
-
126
-
127
-
128
-
129
-
130
-
131
-
132
-
133
-
134
-
135
-
136
-
137
-
138
-
139
-
140
-
141
-
142
-
143
-
144
-
145
-
146
-
147
-
148
-
149
-
150
-
151
-
152
-
153
-
154
-
155
-
156
-
157
-
158
-
159
-
160
-
161
-
162
-
163
-
164
-
165
-
166
-
167
-
168
-
169
-
170
-
171
-
172
-
173
-
174
-
175
-
176
-
177
-
178
-
179
-
180
 |
 |

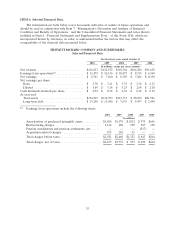
ITEM 6. Selected Financial Data.
The information set forth below is not necessarily indicative of results of future operations and
should be read in conjunction with Item 7, ‘‘Management’s Discussion and Analysis of Financial
Condition and Results of Operations,’’ and the Consolidated Financial Statements and notes thereto
included in Item 8, ‘‘Financial Statements and Supplementary Data,’’ of this Form 10-K, which are
incorporated herein by reference, in order to understand further the factors that may affect the
comparability of the financial data presented below.
HEWLETT-PACKARD COMPANY AND SUBSIDIARIES
Selected Financial Data
For the fiscal years ended October 31
2010 2009 2008 2007 2006
In millions, except per share amounts
Net revenue .......................... $126,033 $114,552 $118,364 $104,286 $91,658
Earnings from operations(1) ............... $ 11,479 $ 10,136 $ 10,473 $ 8,719 $ 6,560
Net earnings .......................... $ 8,761 $ 7,660 $ 8,329 $ 7,264 $ 6,198
Net earnings per share
Basic .............................. $ 3.78 $ 3.21 $ 3.35 $ 2.76 $ 2.23
Diluted ............................ $ 3.69 $ 3.14 $ 3.25 $ 2.68 $ 2.18
Cash dividends declared per share .......... $ 0.32 $ 0.32 $ 0.32 $ 0.32 $ 0.32
At year-end:
Total assets ......................... $124,503 $114,799 $113,331 $ 88,699 $81,981
Long-term debt ...................... $ 15,258 $ 13,980 $ 7,676 $ 4,997 $ 2,490
(1) Earnings from operations include the following items:
2010 2009 2008 2007 2006
In millions
Amortization of purchased intangible assets .......... $1,484 $1,578 $ 1012 $ 973 $656
Restructuring charges .......................... 1,144 640 270 387 158
Pension curtailments and pension settlements, net .....———(517) —
Acquisition-related charges ...................... 293 242 41 — —
Total charges before taxes ....................... $2,921 $2,460 $1,323 $ 843 $814
Total charges, net of taxes ...................... $2,105 $1,733 $ 973 $ 690 $604
35