HP 2010 Annual Report Download - page 66
Download and view the complete annual report
Please find page 66 of the 2010 HP annual report below. You can navigate through the pages in the report by either clicking on the pages listed below, or by using the keyword search tool below to find specific information within the annual report.-
 1
1 -
2
-
3
-
4
-
5
-
6
-
7
-
8
-
9
-
10
-
11
-
12
-
13
-
14
-
15
-
16
-
17
-
18
-
19
-
20
-
21
-
22
-
23
-
24
-
25
-
26
-
27
-
28
-
29
-
30
-
31
-
32
-
33
-
34
-
35
-
36
-
37
-
38
-
39
-
40
-
41
-
42
-
43
-
44
-
45
-
46
-
47
-
48
-
49
-
50
-
51
-
52
-
53
-
54
-
55
-
 56
56 -
 57
57 -
 58
58 -
 59
59 -
 60
60 -
 61
61 -
 62
62 -
 63
63 -
 64
64 -
 65
65 -
 66
66 -
 67
67 -
 68
68 -
 69
69 -
 70
70 -
 71
71 -
 72
72 -
 73
73 -
 74
74 -
 75
75 -
 76
76 -
77
-
78
-
79
-
80
-
81
-
82
-
83
-
84
-
85
-
86
-
87
-
88
-
89
-
90
-
91
-
92
-
93
-
94
-
95
-
96
-
97
-
98
-
99
-
100
-
101
-
102
-
103
-
104
-
105
-
106
-
107
-
108
-
109
-
110
-
111
-
112
-
113
-
114
-
115
-
116
-
117
-
118
-
119
-
120
-
121
-
122
-
123
-
124
-
125
-
126
-
127
-
128
-
129
-
130
-
131
-
132
-
133
-
134
-
135
-
136
-
137
-
138
-
139
-
140
-
141
-
142
-
143
-
144
-
145
-
146
-
147
-
148
-
149
-
150
-
151
-
152
-
153
-
154
-
155
-
156
-
157
-
158
-
159
-
160
-
161
-
162
-
163
-
164
-
165
-
166
-
167
-
168
-
169
-
170
-
171
-
172
-
173
-
174
-
175
-
176
-
177
-
178
-
179
-
180
 |
 |

HEWLETT-PACKARD COMPANY AND SUBSIDIARIES
Management’s Discussion and Analysis of
Financial Condition and Results of Operations (Continued)
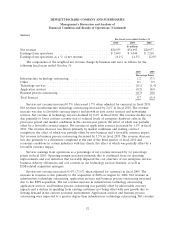
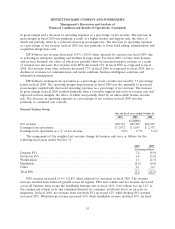
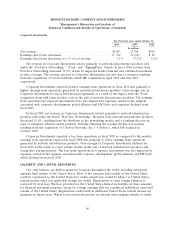
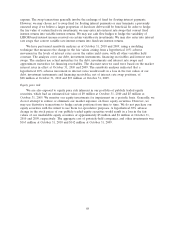
HP Financial Services
For the fiscal years ended October 31
2010 2009 2008
In millions
Net revenue .......................................... $3,047 $2,673 $2,698
Earnings from operations ................................ $ 281 $ 206 $ 192
Earnings from operations as a % of net revenue ................ 9.2% 7.7% 7.1%
HPFS net revenue increased by 14% in fiscal 2010. The net revenue increase was due to portfolio
growth as a result of higher customer demand, a higher operating lease mix due to higher service-led
financing volume, and higher end-of-lease rental, buyout and remarketing activity, along with favorable
currency movements.
HPFS earnings from operations as a percentage of net revenue increased by 1.5 percentage points
in fiscal 2010 due primarily to an increase in gross margin and a decrease in operating expenses as a
percentage of revenue. The increase in gross margin was the result of higher portfolio margins due to
favorable financing conditions and higher remarketing margin, the effect of which was partially offset
by higher bad debt and lower buyout margins. The decrease in operating expenses as a percentage of
revenue was driven primarily by improved cost efficiencies.
HPFS net revenue decreased by 0.9% in fiscal 2009. The net revenue decrease was due to
unfavorable currency movements. On a constant currency basis, fiscal 2009 net revenue increased due
primarily to portfolio growth, increased operating lease mix and higher buyout activities, the effect of
which was partially offset by lower levels of remarketing and end-of-lease activity.
HPFS earnings from operations as a percentage of net revenue increased by 0.6 percentage points
in fiscal 2009 due primarily to a decrease in operating expenses, the effect of which was partially offset
by a decline in gross margin. The operating expense decrease was due to continued cost controls. The
decline in gross margin was driven by an unfavorable currency impact, lower margins relating to end of
lease activity, higher bad debt expenses, and lower remarketing and buyout margins, the effect of which
was partially offset by higher portfolio margins.
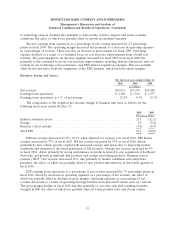
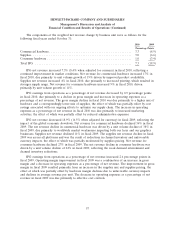
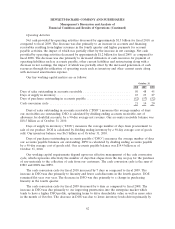
Financing Originations
For the fiscal years ended October 31
2010 2009 2008
In millions
Total financing originations ............................... $5,987 $5,210 $4,872
New financing originations, which represent the amount of financing provided to customers for
equipment and related software and services including intercompany activity, increased 14.9% in fiscal
2010 from fiscal 2009 and 6.9% in fiscal 2009 from fiscal 2008. The increases reflect higher financing
associated with HP product sales and services offerings resulting from improved integration and
engagement with HP’s sales efforts and a favorable currency impact.
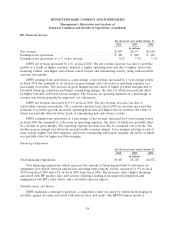
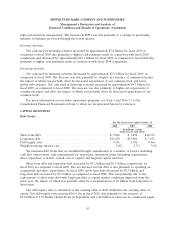
Portfolio Assets and Ratios
HPFS maintains a strategy to generate a competitive return on equity by effectively leveraging its
portfolio against the risks associated with interest rates and credit. The HPFS business model is
58