HP 2010 Annual Report Download - page 55
Download and view the complete annual report
Please find page 55 of the 2010 HP annual report below. You can navigate through the pages in the report by either clicking on the pages listed below, or by using the keyword search tool below to find specific information within the annual report.-
 1
1 -
2
-
3
-
4
-
5
-
6
-
7
-
8
-
9
-
10
-
11
-
12
-
13
-
14
-
15
-
16
-
17
-
18
-
19
-
20
-
21
-
22
-
23
-
24
-
25
-
26
-
27
-
28
-
29
-
30
-
31
-
32
-
33
-
34
-
35
-
36
-
37
-
38
-
39
-
40
-
41
-
42
-
43
-
44
-
 45
45 -
 46
46 -
 47
47 -
 48
48 -
 49
49 -
 50
50 -
 51
51 -
 52
52 -
 53
53 -
 54
54 -
 55
55 -
 56
56 -
 57
57 -
 58
58 -
 59
59 -
 60
60 -
 61
61 -
 62
62 -
 63
63 -
 64
64 -
 65
65 -
66
-
67
-
68
-
69
-
70
-
71
-
72
-
73
-
74
-
75
-
76
-
77
-
78
-
79
-
80
-
81
-
82
-
83
-
84
-
85
-
86
-
87
-
88
-
89
-
90
-
91
-
92
-
93
-
94
-
95
-
96
-
97
-
98
-
99
-
100
-
101
-
102
-
103
-
104
-
105
-
106
-
107
-
108
-
109
-
110
-
111
-
112
-
113
-
114
-
115
-
116
-
117
-
118
-
119
-
120
-
121
-
122
-
123
-
124
-
125
-
126
-
127
-
128
-
129
-
130
-
131
-
132
-
133
-
134
-
135
-
136
-
137
-
138
-
139
-
140
-
141
-
142
-
143
-
144
-
145
-
146
-
147
-
148
-
149
-
150
-
151
-
152
-
153
-
154
-
155
-
156
-
157
-
158
-
159
-
160
-
161
-
162
-
163
-
164
-
165
-
166
-
167
-
168
-
169
-
170
-
171
-
172
-
173
-
174
-
175
-
176
-
177
-
178
-
179
-
180
 |
 |

HEWLETT-PACKARD COMPANY AND SUBSIDIARIES
Management’s Discussion and Analysis of
Financial Condition and Results of Operations (Continued)
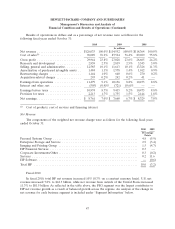
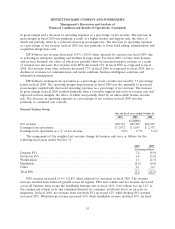
Results of operations in dollars and as a percentage of net revenue were as follows for the
following fiscal years ended October 31:
2010 2009 2008
In millions
Net revenue ......................... $126,033 100.0% $114,552 100.0% $118,364 100.0%
Cost of sales(1) ....................... 96,089 76.2% 87,524 76.4% 89,699 75.8%
Gross profit ......................... 29,944 23.8% 27,028 23.6% 28,665 24.2%
Research and development .............. 2,959 2.3% 2,819 2.5% 3,543 3.0%
Selling, general and administrative ......... 12,585 10.1% 11,613 10.1% 13,326 11.3%
Amortization of purchased intangible assets . . 1,484 1.1% 1,578 1.4% 1,012 0.9%
Restructuring charges .................. 1,144 1.0% 640 0.6% 270 0.2%
Acquisition-related charges .............. 293 0.2% 242 0.2% 41 —
Earnings from operations ............... 11,479 9.1% 10,136 8.8% 10,473 8.8%
Interest and other, net ................. (505) (0.4)% (721) (0.6)% — —
Earnings before taxes .................. 10,974 8.7% 9,415 8.2% 10,473 8.8%
Provision for taxes .................... 2,213 1.7% 1,755 1.5% 2,144 1.8%
Net earnings ......................... $ 8,761 7.0% $ 7,660 6.7% $ 8,329 7.0%
(1) Cost of products, cost of services and financing interest.
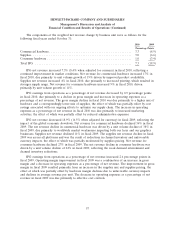
Net Revenue
The components of the weighted net revenue change were as follows for the following fiscal years
ended October 31:
2010 2009
Percentage
Points
Personal Systems Group ................................................ 4.8 (5.9)
Enterprise Storage and Servers ........................................... 2.9 (3.4)
Imaging and Printing Group ............................................. 1.5 (4.7)
HP Financial Services .................................................. 0.3 —
Corporate Investments/Other ............................................. 0.3 (0.2)
Services ............................................................ 0.2 11.6
HP Software ......................................................... — (0.6)
Total HP ........................................................... 10.0 (3.2)
Fiscal 2010
In fiscal 2010, total HP net revenue increased 10% (8.3% on a constant currency basis). U.S. net
revenue increased 7.8% to $44.5 billion, while net revenue from outside of the United States increased
11.3% to $81.5 billion. As reflected in the table above, the PSG segment was the largest contributor to
HP net revenue growth as a result of balanced growth across the regions. An analysis of the change in
net revenue for each business segment is included under ‘‘Segment Information’’ below.
47