HP 2010 Annual Report Download - page 120
Download and view the complete annual report
Please find page 120 of the 2010 HP annual report below. You can navigate through the pages in the report by either clicking on the pages listed below, or by using the keyword search tool below to find specific information within the annual report.-
 1
1 -
2
-
3
-
4
-
5
-
6
-
7
-
8
-
9
-
10
-
11
-
12
-
13
-
14
-
15
-
16
-
17
-
18
-
19
-
20
-
21
-
22
-
23
-
24
-
25
-
26
-
27
-
28
-
29
-
30
-
31
-
32
-
33
-
34
-
35
-
36
-
37
-
38
-
39
-
40
-
41
-
42
-
43
-
44
-
45
-
46
-
47
-
48
-
49
-
50
-
51
-
52
-
53
-
54
-
55
-
56
-
57
-
58
-
59
-
60
-
61
-
62
-
63
-
64
-
65
-
66
-
67
-
68
-
69
-
70
-
71
-
72
-
73
-
74
-
75
-
76
-
77
-
78
-
79
-
80
-
81
-
82
-
83
-
84
-
85
-
86
-
87
-
88
-
89
-
90
-
91
-
92
-
93
-
94
-
95
-
96
-
97
-
98
-
99
-
100
-
101
-
102
-
103
-
104
-
105
-
106
-
107
-
108
-
109
-
 110
110 -
 111
111 -
 112
112 -
 113
113 -
 114
114 -
 115
115 -
 116
116 -
 117
117 -
 118
118 -
 119
119 -
 120
120 -
 121
121 -
 122
122 -
 123
123 -
 124
124 -
 125
125 -
 126
126 -
 127
127 -
 128
128 -
 129
129 -
 130
130 -
131
-
132
-
133
-
134
-
135
-
136
-
137
-
138
-
139
-
140
-
141
-
142
-
143
-
144
-
145
-
146
-
147
-
148
-
149
-
150
-
151
-
152
-
153
-
154
-
155
-
156
-
157
-
158
-
159
-
160
-
161
-
162
-
163
-
164
-
165
-
166
-
167
-
168
-
169
-
170
-
171
-
172
-
173
-
174
-
175
-
176
-
177
-
178
-
179
-
180
 |
 |

HEWLETT-PACKARD COMPANY AND SUBSIDIARIES
Notes to Consolidated Financial Statements (Continued)
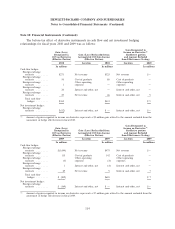
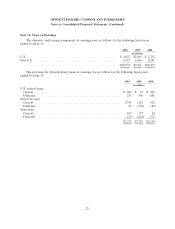
Note 10: Financial Instruments (Continued)
Hedge Effectiveness
For interest rate swaps designated as fair value hedges, HP measures effectiveness by offsetting the
change in fair value of the hedged debt with the change in fair value of the derivative. For foreign
currency options and forward contracts designated as cash flow or net investment hedges, HP measures
effectiveness by comparing the cumulative change in the hedge contract with the cumulative change in
the hedged item, both of which are based on forward rates. HP recognizes any ineffective portion of
the hedge, as well as amounts not included in the assessment of effectiveness, in the Consolidated
Statements of Earnings. As of October 31, 2010 and October 31, 2009, the portion of hedging
instruments’ gain or loss excluded from the assessment of effectiveness was not material for fair value,
cash flow or net investment hedges. Hedge ineffectiveness for fair value, cash flow and net investment
hedges was not material in fiscal years 2010, 2009 and 2008.
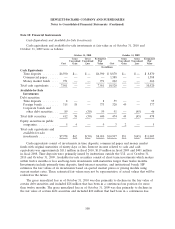
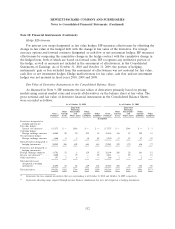
Fair Value of Derivative Instruments in the Consolidated Balance Sheets
As discussed in Note 9, HP estimates the fair values of derivatives primarily based on pricing
models using current market rates and records all derivatives on the balance sheet at fair value. The
gross notional and fair value of derivative financial instruments in the Consolidated Balance Sheets
were recorded as follows:
As of October 31, 2010 As of October 31, 2009
Long-term Long-term
Financing Financing
Other Receivables Other Other Receivables Other
Gross Current and Accrued Other Gross Current and Accrued Other
Notional(1) Assets Other Assets Liabilities Liabilities Notional(1) Assets Other Assets Liabilities Liabilities
In millions
Derivatives designated as
hedging instruments
Fair value hedges:
Interest rate contracts .... $8,575 $ — $656 $ — $ — $ 7,575 $ — $346 $ — $ 5
Cash flow hedges:
Foreign exchange contracts . 16,862 98 20 503 83 15,056 116 12 389 33
Net investment hedges:
Foreign exchange contracts . 1,466 8 2 58 62 1,350 13 12 47 39
Total derivatives designated as
hedging instruments ..... 26,903 106 678 561 145 23,981 129 370 436 77
Derivatives not designated as
hedging instruments
Foreign exchange contracts . . 13,701 51 3 129 55 16,104 206 20 163 51
Interest rate contracts
(2)
.... 2,200 — 79 — 89 2,211 — 29 — 45
Other derivatives ........ 397 5 6 — — 268 2 — 2 —
Total derivatives not
designated as hedging
instruments .......... 16,298 56 88 129 144 18,583 208 49 165 96
Total derivatives ......... $43,201 $162 $766 $690 $289 $42,564 $337 $419 $601 $173
(1)
Represents the face amounts of contracts that were outstanding as of October 31, 2010 and October 31, 2009, respectively.
(2)
Represents offsetting swaps acquired through previous business combination that were not designated as hedging instruments.
112