HP 2010 Annual Report Download - page 140
Download and view the complete annual report
Please find page 140 of the 2010 HP annual report below. You can navigate through the pages in the report by either clicking on the pages listed below, or by using the keyword search tool below to find specific information within the annual report.-
 1
1 -
2
-
3
-
4
-
5
-
6
-
7
-
8
-
9
-
10
-
11
-
12
-
13
-
14
-
15
-
16
-
17
-
18
-
19
-
20
-
21
-
22
-
23
-
24
-
25
-
26
-
27
-
28
-
29
-
30
-
31
-
32
-
33
-
34
-
35
-
36
-
37
-
38
-
39
-
40
-
41
-
42
-
43
-
44
-
45
-
46
-
47
-
48
-
49
-
50
-
51
-
52
-
53
-
54
-
55
-
56
-
57
-
58
-
59
-
60
-
61
-
62
-
63
-
64
-
65
-
66
-
67
-
68
-
69
-
70
-
71
-
72
-
73
-
74
-
75
-
76
-
77
-
78
-
79
-
80
-
81
-
82
-
83
-
84
-
85
-
86
-
87
-
88
-
89
-
90
-
91
-
92
-
93
-
94
-
95
-
96
-
97
-
98
-
99
-
100
-
101
-
102
-
103
-
104
-
105
-
106
-
107
-
108
-
109
-
110
-
111
-
112
-
113
-
114
-
115
-
116
-
117
-
118
-
119
-
120
-
121
-
122
-
123
-
124
-
125
-
126
-
127
-
128
-
129
-
 130
130 -
 131
131 -
 132
132 -
 133
133 -
 134
134 -
 135
135 -
 136
136 -
 137
137 -
 138
138 -
 139
139 -
 140
140 -
 141
141 -
 142
142 -
 143
143 -
 144
144 -
 145
145 -
 146
146 -
 147
147 -
 148
148 -
 149
149 -
 150
150 -
151
-
152
-
153
-
154
-
155
-
156
-
157
-
158
-
159
-
160
-
161
-
162
-
163
-
164
-
165
-
166
-
167
-
168
-
169
-
170
-
171
-
172
-
173
-
174
-
175
-
176
-
177
-
178
-
179
-
180
 |
 |

HEWLETT-PACKARD COMPANY AND SUBSIDIARIES
Notes to Consolidated Financial Statements (Continued)
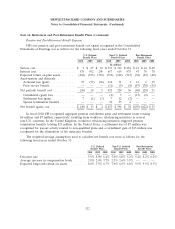
Note 16: Retirement and Post-Retirement Benefit Plans (Continued)
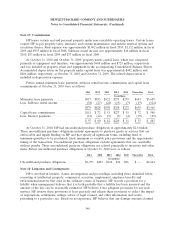
Pension and Post-Retirement Benefit Expense
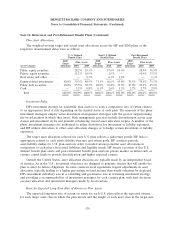
HP’s net pension and post-retirement benefit cost (gain) recognized in the Consolidated
Statements of Earnings was as follows for the following fiscal years ended October 31:
U.S. Defined Non-U.S. Defined Post-Retirement
Benefit Plans Benefit Plans Benefit Plans
2010 2009 2008 2010 2009 2008 2010 2009 2008
In millions
Service cost ...................... $ 1 $ 27 $ 63 $319 $312 $281 $12 $14 $29
Interest cost ...................... 578 592 296 657 619 475 47 70 78
Expected return on plan assets ........ (662) (533) (318) (756) (669) (713) (32) (32) (40)
Amortization and deferrals:
Actuarial loss (gain) .............. 27 (72) (36) 214 71 1 14 6 19
Prior service benefit ..............———(11)(9)(8)(87)(78)(55)
Net periodic benefit cost ............. (56) 14 5 423 324 36 (46) (20) 31
Curtailment (gain) loss ............——— (6)5—(13)(2)—
Settlement loss (gain) ............. 7 (1) (1) 7 12 (2) — — —
Special termination benefits .........———2955 4———
Net benefit (gain) cost .............. $ (49)$ 13 $ 4 $453 $396 $ 38 $(59) $(22) $ 31
In fiscal 2010, HP recognized aggregate pension curtailment gains and settlement losses totaling
$6 million and $7 million, respectively, resulting from workforce rebalancing initiatives in several
non-U.S. countries. In the United Kingdom, workforce rebalancing initiatives triggered pension
termination benefits totaling $29 million. In the United States, a settlement loss of $7 million was
recognized for payout activity related to non-qualified plans and a curtailment gain of $13 million was
recognized for the elimination of life insurance benefits.
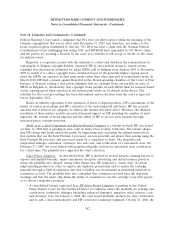
The weighted-average assumptions used to calculate net benefit cost were as follows for the
following fiscal years ended October 31:
U.S. Defined Non-U.S. Defined Post-Retirement
Benefit Plans Benefit Plans Benefit Plans
2010 2009 2008 2010 2009 2008 2010 2009 2008
Discount rate ........................... 5.9% 8.0% 6.4% 5.0% 6.0% 5.2% 5.4% 8.2% 6.2%
Average increase in compensation levels ....... 2.0% 2.0% 3.7% 2.5% 2.6% 3.3% — — —
Expected long-term return on assets .......... 8.0% 7.5% 6.7% 7.0% 6.9% 6.8% 9.5% 9.3% 8.7%
132