HP 2010 Annual Report Download - page 68
Download and view the complete annual report
Please find page 68 of the 2010 HP annual report below. You can navigate through the pages in the report by either clicking on the pages listed below, or by using the keyword search tool below to find specific information within the annual report.-
 1
1 -
2
-
3
-
4
-
5
-
6
-
7
-
8
-
9
-
10
-
11
-
12
-
13
-
14
-
15
-
16
-
17
-
18
-
19
-
20
-
21
-
22
-
23
-
24
-
25
-
26
-
27
-
28
-
29
-
30
-
31
-
32
-
33
-
34
-
35
-
36
-
37
-
38
-
39
-
40
-
41
-
42
-
43
-
44
-
45
-
46
-
47
-
48
-
49
-
50
-
51
-
52
-
53
-
54
-
55
-
56
-
57
-
 58
58 -
 59
59 -
 60
60 -
 61
61 -
 62
62 -
 63
63 -
 64
64 -
 65
65 -
 66
66 -
 67
67 -
 68
68 -
 69
69 -
 70
70 -
 71
71 -
 72
72 -
 73
73 -
 74
74 -
 75
75 -
 76
76 -
 77
77 -
 78
78 -
79
-
80
-
81
-
82
-
83
-
84
-
85
-
86
-
87
-
88
-
89
-
90
-
91
-
92
-
93
-
94
-
95
-
96
-
97
-
98
-
99
-
100
-
101
-
102
-
103
-
104
-
105
-
106
-
107
-
108
-
109
-
110
-
111
-
112
-
113
-
114
-
115
-
116
-
117
-
118
-
119
-
120
-
121
-
122
-
123
-
124
-
125
-
126
-
127
-
128
-
129
-
130
-
131
-
132
-
133
-
134
-
135
-
136
-
137
-
138
-
139
-
140
-
141
-
142
-
143
-
144
-
145
-
146
-
147
-
148
-
149
-
150
-
151
-
152
-
153
-
154
-
155
-
156
-
157
-
158
-
159
-
160
-
161
-
162
-
163
-
164
-
165
-
166
-
167
-
168
-
169
-
170
-
171
-
172
-
173
-
174
-
175
-
176
-
177
-
178
-
179
-
180
 |
 |

HEWLETT-PACKARD COMPANY AND SUBSIDIARIES
Management’s Discussion and Analysis of
Financial Condition and Results of Operations (Continued)
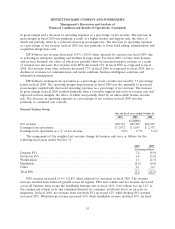
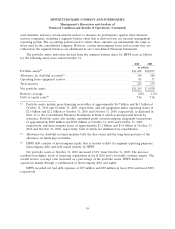
Corporate Investments
For the fiscal years ended October 31
2010 2009 2008
In millions
Net revenue ......................................... $1,863 $ 768 $965
Earnings (loss) from operations ........................... $ 132 $ (56) $ 49
Earnings (loss) from operations as a % of net revenue .......... 7.1% (7.3)% 5.1%
Net revenue in Corporate Investments relates primarily to network infrastructure products sold
under the ‘‘ProCurve Networking,’’ ‘‘3Com’’ and ‘‘TippingPoint’’ brands. In fiscal 2010, revenue from
ProCurve Networking increased 33.9%, driven by improved market demand and continued investment
in sales coverage. The revenue increase in Corporate Investments was also due to revenues resulting
from the acquisitions of 3Com and Palm, which HP completed in April 2010 and July 2010,
respectively.
Corporate Investments reported positive earnings from operations in fiscal 2010 due primarily to
higher earnings from operations generated by network infrastructure products. Gross margin rate in
Corporate Investments for fiscal 2010 increased primarily as a result of the impact from the 3Com
acquisition along with lower product costs in the sale of network infrastructure products. The earnings
from operations in Corporate Investments were also impacted by expenses carried in the segment
associated with corporate development, global alliances and HP Labs; such expenses declined from
fiscal 2009.
In fiscal 2009, net revenue in Corporate Investments related primarily to network infrastructure
products sold under the brand ‘‘ProCurve Networking.’’ Revenue from network infrastructure products
decreased 19.6%, resulting from the slowdown in the networking market and a resulting decrease in
sales of enterprise ethernet switch products. Partially offsetting the revenue decline was revenue
resulting from the acquisition of Colubris Networks, Inc. (‘‘Colubris’’), which HP acquired in
October 2008.
Corporate Investments reported a loss from operations in fiscal 2009 as compared to the positive
earnings from operations reported in fiscal 2008 due primarily to lower earnings from operations
generated by network infrastructure products. Gross margin in Corporate Investments declined for
fiscal 2009 as the result of a unit volume decline in the sale of network infrastructure products and
competitive pricing pressure. The loss from operations in Corporate Investments was also impacted by
expenses carried in the segment associated with corporate development, global alliances and HP Labs,
which declined from fiscal 2008.
LIQUIDITY AND CAPITAL RESOURCES
Our cash balances are held in numerous locations throughout the world, including substantial
amounts held outside of the United States. Most of the amounts held outside of the United States
could be repatriated to the United States but, under current law, would be subject to United States
federal income taxes, less applicable foreign tax credits. Repatriation of some foreign balances is
restricted by local laws. We have provided for the United States federal tax liability on these amounts
for financial statement purposes, except for foreign earnings that are considered indefinitely reinvested
outside of the United States. Repatriation could result in additional United States federal income tax
payments in future years. Where local restrictions prevent an efficient intercompany transfer of funds,
60