HP 2010 Annual Report Download - page 56
Download and view the complete annual report
Please find page 56 of the 2010 HP annual report below. You can navigate through the pages in the report by either clicking on the pages listed below, or by using the keyword search tool below to find specific information within the annual report.-
 1
1 -
2
-
3
-
4
-
5
-
6
-
7
-
8
-
9
-
10
-
11
-
12
-
13
-
14
-
15
-
16
-
17
-
18
-
19
-
20
-
21
-
22
-
23
-
24
-
25
-
26
-
27
-
28
-
29
-
30
-
31
-
32
-
33
-
34
-
35
-
36
-
37
-
38
-
39
-
40
-
41
-
42
-
43
-
44
-
45
-
 46
46 -
 47
47 -
 48
48 -
 49
49 -
 50
50 -
 51
51 -
 52
52 -
 53
53 -
 54
54 -
 55
55 -
 56
56 -
 57
57 -
 58
58 -
 59
59 -
 60
60 -
 61
61 -
 62
62 -
 63
63 -
 64
64 -
 65
65 -
 66
66 -
67
-
68
-
69
-
70
-
71
-
72
-
73
-
74
-
75
-
76
-
77
-
78
-
79
-
80
-
81
-
82
-
83
-
84
-
85
-
86
-
87
-
88
-
89
-
90
-
91
-
92
-
93
-
94
-
95
-
96
-
97
-
98
-
99
-
100
-
101
-
102
-
103
-
104
-
105
-
106
-
107
-
108
-
109
-
110
-
111
-
112
-
113
-
114
-
115
-
116
-
117
-
118
-
119
-
120
-
121
-
122
-
123
-
124
-
125
-
126
-
127
-
128
-
129
-
130
-
131
-
132
-
133
-
134
-
135
-
136
-
137
-
138
-
139
-
140
-
141
-
142
-
143
-
144
-
145
-
146
-
147
-
148
-
149
-
150
-
151
-
152
-
153
-
154
-
155
-
156
-
157
-
158
-
159
-
160
-
161
-
162
-
163
-
164
-
165
-
166
-
167
-
168
-
169
-
170
-
171
-
172
-
173
-
174
-
175
-
176
-
177
-
178
-
179
-
180
 |
 |
HEWLETT-PACKARD COMPANY AND SUBSIDIARIES
Management’s Discussion and Analysis of
Financial Condition and Results of Operations (Continued)
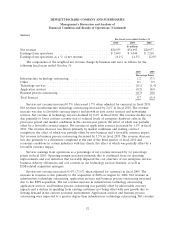
Fiscal 2009
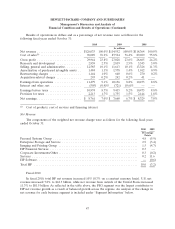
In fiscal 2009, the global slowdown of IT and consumer spending impacted each of our segments.
Net revenue decreased 3.2% in fiscal 2009 (increased 1.3% on a constant currency basis). The
unfavorable currency impact for fiscal 2009 was due primarily to the movement of the dollar against
the euro. For fiscal 2009, the Services segment contributed favorably to the total HP net revenue
change primarily as a result of the EDS acquisition. U.S. net revenue increased 12% to $41.3 billion for
fiscal 2009 as compared to fiscal 2008, while net revenue from outside of the United States decreased
10% to $73.2 billion. The increase in U.S. net revenue in fiscal 2009 was primarily a result of the
acquisition of EDS. An analysis of the change in net revenue for each business segment is included
under ‘‘Segment Information’’ below.
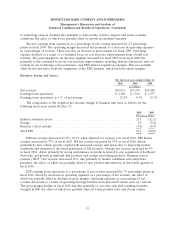
Gross Margin
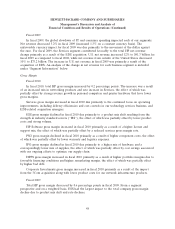
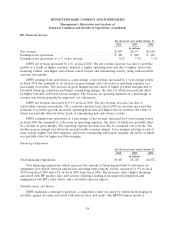
Fiscal 2010
In fiscal 2010, total HP gross margin increased by 0.2 percentage points. The increase was a result
of an increased mix in networking products and rate increase in Services, the effect of which was
partially offset by strong revenue growth in personal computers and printer hardware that have lower
gross margins.
Services gross margin increased in fiscal 2010 due primarily to the continued focus on operating
improvements, including delivery efficiencies and cost controls in our technology services business, and
EDS-related acquisition synergies.
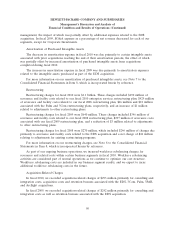
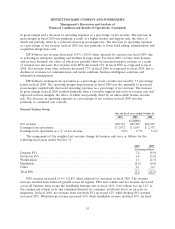
ESS gross margin declined in fiscal 2010 due primarily to a product mix shift resulting from the
strength in industry standard servers (‘‘ISS’’), the effect of which was partially offset by lower product
costs and strong volume.
HP Software gross margin increased in fiscal 2010 primarily as a result of a higher license and
support mix, the effect of which was partially offset by a reduced services gross margin rate.
PSG gross margin declined in fiscal 2010 primarily as a result of higher component costs, the effect
of which was partially offset by lower warranty and logistics expenses.
IPG gross margin declined in fiscal 2010 due primarily to a higher mix of hardware and a
correspondingly lower mix of supplies, the effect of which was partially offset by cost savings associated
with our ongoing efforts to optimize our supply chain.
HPFS gross margin increased in fiscal 2010 primarily as a result of higher portfolio margins due to
favorable financing conditions and higher remarketing margin, the effect of which was partially offset
by higher bad debt.
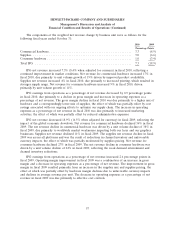
Corporate Investments gross margin increased in fiscal 2010 primarily as a result of the impact
from the 3Com acquisition along with lower product costs for our network infrastructure products.
Fiscal 2009
Total HP gross margin decreased by 0.6 percentage points in fiscal 2009. From a segment
perspective and on a weighted basis, ESS had the largest impact to the total company gross margin
decline due to product mix shift and rate declines.
48