HP 2010 Annual Report Download - page 159
Download and view the complete annual report
Please find page 159 of the 2010 HP annual report below. You can navigate through the pages in the report by either clicking on the pages listed below, or by using the keyword search tool below to find specific information within the annual report.-
 1
1 -
2
-
3
-
4
-
5
-
6
-
7
-
8
-
9
-
10
-
11
-
12
-
13
-
14
-
15
-
16
-
17
-
18
-
19
-
20
-
21
-
22
-
23
-
24
-
25
-
26
-
27
-
28
-
29
-
30
-
31
-
32
-
33
-
34
-
35
-
36
-
37
-
38
-
39
-
40
-
41
-
42
-
43
-
44
-
45
-
46
-
47
-
48
-
49
-
50
-
51
-
52
-
53
-
54
-
55
-
56
-
57
-
58
-
59
-
60
-
61
-
62
-
63
-
64
-
65
-
66
-
67
-
68
-
69
-
70
-
71
-
72
-
73
-
74
-
75
-
76
-
77
-
78
-
79
-
80
-
81
-
82
-
83
-
84
-
85
-
86
-
87
-
88
-
89
-
90
-
91
-
92
-
93
-
94
-
95
-
96
-
97
-
98
-
99
-
100
-
101
-
102
-
103
-
104
-
105
-
106
-
107
-
108
-
109
-
110
-
111
-
112
-
113
-
114
-
115
-
116
-
117
-
118
-
119
-
120
-
121
-
122
-
123
-
124
-
125
-
126
-
127
-
128
-
129
-
130
-
131
-
132
-
133
-
134
-
135
-
136
-
137
-
138
-
139
-
140
-
141
-
142
-
143
-
144
-
145
-
146
-
147
-
148
-
 149
149 -
 150
150 -
 151
151 -
 152
152 -
 153
153 -
 154
154 -
 155
155 -
 156
156 -
 157
157 -
 158
158 -
 159
159 -
 160
160 -
 161
161 -
 162
162 -
 163
163 -
 164
164 -
 165
165 -
 166
166 -
 167
167 -
 168
168 -
 169
169 -
170
-
171
-
172
-
173
-
174
-
175
-
176
-
177
-
178
-
179
-
180
 |
 |

HEWLETT-PACKARD COMPANY AND SUBSIDIARIES
Notes to Consolidated Financial Statements (Continued)
Note 19: Segment Information (Continued)
services. HPFS offers leasing, financing, utility programs, and asset recovery services, as well as
financial asset management services, for large global and enterprise customers. HPFS also
provides an array of specialized financial services to SMBs and educational and governmental
entities. HPFS offers innovative, customized and flexible alternatives to balance unique customer
cash flow, technology obsolescence and capacity needs.
•Corporate Investments includes HP Labs, network infrastructure products, mobile devices
associated with the Palm acquisition, and certain business incubation projects. Revenue in this
segment is attributable to the sale of certain network infrastructure products, which span from
the data center to the edge of the network and are sold under the ProCurve, 3Com and
TippingPoint brands. The segment also includes certain video collaboration products sold under
the brand ‘‘Halo,’’ and Palm smartphones, which are targeted at the consumer segment and
include the Pixi and Pre models running on the WebOS operating system. This segment also
derives revenue from licensing specific HP technology to third parties.
Segment Data
HP derives the results of the business segments directly from its internal management reporting
system. The accounting policies HP uses to derive business segment results are substantially the same
as those the consolidated company uses. Management measures the performance of each business
segment based on several metrics, including earnings from operations. Management uses these results,
in part, to evaluate the performance of, and to assign resources to, each of the business segments. HP
does not allocate to its business segments certain operating expenses, which it manages separately at
the corporate level. These unallocated costs include primarily restructuring charges and any associated
adjustments related to restructuring actions, amortization of purchased intangible assets, stock-based
compensation expense related to HP-granted employee stock options, PRUs, restricted stock awards
and the employee stock purchase plan, certain acquisition-related charges and charges for purchased
IPR&D, as well as certain corporate governance costs.
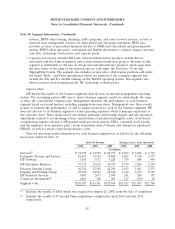
Selected operating results information for each business segment was as follows for the following
fiscal years ended October 31:
Total Net Revenue Earnings (Loss) from Operations
2010 2009 2008 2010 2009 2008
In millions
Services(1) ...................... $ 34,935 $ 34,693 $ 20,977 $ 5,609 $ 5,044 $ 2,518
Enterprise Storage and Servers ...... 18,651 15,359 19,400 2,402 1,518 2,577
HP Software .................... 3,586 3,572 4,220 759 684 499
HP Enterprise Business ............ 57,172 53,624 44,597 8,770 7,246 5,594
Personal Systems Group ........... 40,741 35,305 42,295 2,032 1,661 2,375
Imaging and Printing Group ........ 25,764 24,011 29,614 4,412 4,310 4,559
HP Financial Services ............. 3,047 2,673 2,698 281 206 192
Corporate Investments(2) ........... 1,863 768 965 132 (56) 49
Segment total ................... $128,587 $116,381 $120,169 $15,627 $13,367 $12,769
(1) Includes the results of EDS, which was acquired on August 26, 2008, from the date of acquisition.
(2) Includes the results of 3Com and Palm acquisitions completed in April 2010 and July 2010,
respectively.
151