Google 2011 Annual Report Download - page 99
Download and view the complete annual report
Please find page 99 of the 2011 Google annual report below. You can navigate through the pages in the report by either clicking on the pages listed below, or by using the keyword search tool below to find specific information within the annual report.-
 1
1 -
2
-
3
-
4
-
5
-
6
-
7
-
8
-
9
-
10
-
11
-
12
-
13
-
14
-
15
-
16
-
17
-
18
-
19
-
20
-
21
-
22
-
23
-
24
-
25
-
26
-
27
-
28
-
29
-
30
-
31
-
32
-
33
-
34
-
35
-
36
-
37
-
38
-
39
-
40
-
41
-
42
-
43
-
44
-
45
-
46
-
47
-
48
-
49
-
50
-
51
-
52
-
53
-
54
-
55
-
56
-
57
-
58
-
59
-
60
-
61
-
62
-
63
-
64
-
65
-
66
-
67
-
68
-
69
-
70
-
71
-
72
-
73
-
74
-
75
-
76
-
77
-
78
-
79
-
80
-
81
-
82
-
83
-
84
-
85
-
86
-
87
-
88
-
 89
89 -
 90
90 -
 91
91 -
 92
92 -
 93
93 -
 94
94 -
 95
95 -
 96
96 -
 97
97 -
 98
98 -
 99
99 -
 100
100 -
 101
101 -
 102
102 -
 103
103 -
 104
104 -
 105
105 -
 106
106 -
 107
107 -
 108
108 -
 109
109 -
110
-
111
-
112
-
113
-
114
-
115
-
116
-
117
-
118
-
119
-
120
-
121
-
122
-
123
-
124
 |
 |

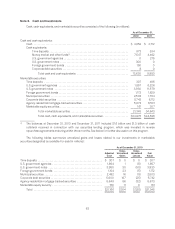
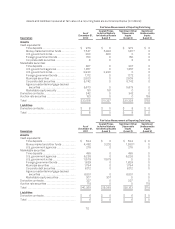
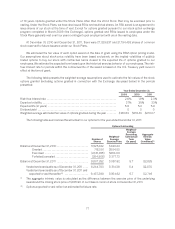
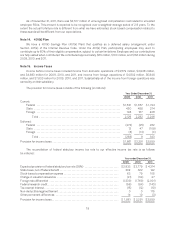
Assets and liabilities measured at fair value on a recurring basis are summarized below (in millions):
Description
As of
December 31,
2010
Fair Value Measurement at Reporting Date Using
Quoted Prices
in Active Markets
for Identical Assets
(Level 1)
Significant Other
Observable
Inputs
(Level 2)
Significant
Unobservable
Inputs
(Level 3)
Assets
Cash equivalents:
Time deposits .......................... $ 973 $ 0 $ 973 $ 0
Money market and other funds ........... 7,547 5,936 1,611(1) 0
U.S. government notes .................. 300 300 0 0
Foreign government bonds .............. 150 0 150 0
Corporate debt securities ................ 8 0 8 0
Marketable securities:
Time deposits .......................... 307 0 307 0
U.S. government agencies ............... 1,857 0 1,857 0
U.S. government notes .................. 3,930 3,930 0 0
Foreign government bonds .............. 1,172 0 1,172 0
Municipal securities .................... 2,503 0 2,503 0
Corporate debt securities ................ 5,742 0 5,742 0
Agency residential mortgage-backed
securities ........................... 5,673 0 5,673 0
Marketable equity security ............... 161 161 0 0
Derivative contracts ......................... 342 0 342 0
Auction rate securities ....................... 153 0 0 153
Total ...................................... $30,818 $10,327 $20,338 $153
Liabilities
Derivative contracts ......................... $ 8 $ 0 $ 8 $ 0
Total ...................................... $ 8 $ 0 $ 8 $ 0
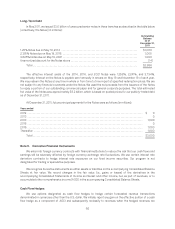
Description
Fair Value Measurement at Reporting Date Using
As of
December 31,
2011
Quoted Prices
in Active Markets
for Identical Assets
(Level 1)
Significant Other
Observable
Inputs
(Level 2)
Significant
Unobservable
Inputs
(Level 3)
Assets
Cash equivalents:
Time deposits .......................... $ 534 $ 0 $ 534 $ 0
Money market and other funds ........... 4,462 3,202 1,260(1) 0
U.S. government agencies ............... 275 0 275 0
Marketable securities:
Time deposits .......................... 495 0 495 0
U.S. government agencies ............... 6,226 0 6,226 0
U.S. government notes .................. 11,579 11,579 0 0
Foreign government bonds .............. 1,629 0 1,629 0
Municipal securities .................... 1,794 0 1,794 0
Corporate debt securities ................ 6,112 0 6,112 0
Agency residential mortgage-backed
securities ........................... 6,501 0 6,501 0
Marketable equity securities ............. 307 307 0 0
Derivative contracts ......................... 337 0 337 0
Auction rate securities ....................... 118 0 0 118
Total ...................................... $40,369 $15,088 $25,163 $118
Liabilities
Derivative contracts ......................... $ 6 $ 0 $ 6 $ 0
Total ...................................... $ 6 $ 0 $ 6 $ 0
70