Google 2011 Annual Report Download - page 59
Download and view the complete annual report
Please find page 59 of the 2011 Google annual report below. You can navigate through the pages in the report by either clicking on the pages listed below, or by using the keyword search tool below to find specific information within the annual report.-
 1
1 -
2
-
3
-
4
-
5
-
6
-
7
-
8
-
9
-
10
-
11
-
12
-
13
-
14
-
15
-
16
-
17
-
18
-
19
-
20
-
21
-
22
-
23
-
24
-
25
-
26
-
27
-
28
-
29
-
30
-
31
-
32
-
33
-
34
-
35
-
36
-
37
-
38
-
39
-
40
-
41
-
42
-
43
-
44
-
45
-
46
-
47
-
48
-
 49
49 -
 50
50 -
 51
51 -
 52
52 -
 53
53 -
 54
54 -
 55
55 -
 56
56 -
 57
57 -
 58
58 -
 59
59 -
 60
60 -
 61
61 -
 62
62 -
 63
63 -
 64
64 -
 65
65 -
 66
66 -
 67
67 -
 68
68 -
 69
69 -
70
-
71
-
72
-
73
-
74
-
75
-
76
-
77
-
78
-
79
-
80
-
81
-
82
-
83
-
84
-
85
-
86
-
87
-
88
-
89
-
90
-
91
-
92
-
93
-
94
-
95
-
96
-
97
-
98
-
99
-
100
-
101
-
102
-
103
-
104
-
105
-
106
-
107
-
108
-
109
-
110
-
111
-
112
-
113
-
114
-
115
-
116
-
117
-
118
-
119
-
120
-
121
-
122
-
123
-
124
 |
 |

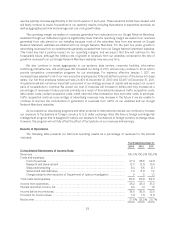
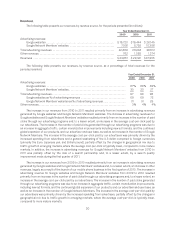
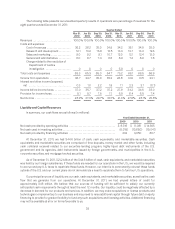
Revenues
The following table presents our revenues, by revenue source, for the periods presented (in millions):
Year Ended December 31,
2009 2010 2011
Advertising revenues:
Google websites .................................................... $15,723 $ 19,444 $ 26,145
Google Network Members’ websites .................................. 7,166 8,792 10,386
Total advertising revenues ............................................... 22,889 28,236 36,531
Other revenues ......................................................... 762 1,085 1,374
Revenues .............................................................. $23,651 $ 29,321 $37,905
The following table presents our revenues, by revenue source, as a percentage of total revenues for the
periods presented:
Year Ended December 31,
2009 2010 2011
Advertising revenues:
Google websites ............................................................ 67% 66% 69%
Google Network Members’ websites ........................................... 30 30 27
Total advertising revenues ........................................................ 97 96 96
Google websites as % of advertising revenues .................................. 69 69 72
Google Network Members’ websites as % of advertising revenues ................. 31 31 28
Other revenues .................................................................. 3% 4% 4%
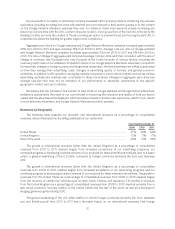
The increase in our revenues from 2010 to 2011 resulted primarily from an increase in advertising revenues
generated by Google websites and Google Network Members’ websites. The increase in advertising revenues for
Google websites and Google Network Members’ websites resulted primarily from an increase in the number of paid
clicks through our advertising programs and, to a lesser extent, an increase in the average cost-per-click paid by
our advertisers. The increase in the number of paid clicks generated through our advertising programs was due to
an increase in aggregate traffic, certain monetization improvements including new ad formats, and the continued
global expansion of our products, and our advertiser and user base, as well as an increase in the number of Google
Network Members. The increase in the average cost-per-click paid by our advertisers was primarily driven by the
increased spending from advertisers and a general weakening of the U.S dollar compared to foreign currencies
(primarily the Euro, Japanese yen, and British pound), partially offset by the changes in geographical mix due to
traffic growth in emerging markets, where the average cost-per-click is typically lower, compared to more mature
markets. In addition, the increase in advertising revenues for Google Network Members’ websites from 2010 to
2011 was partially offset by the loss of a search partnership and, to a lesser extent, by a search quality
improvement made during the first quarter of 2011.
The increase in our revenues from 2009 to 2010 resulted primarily from an increase in advertising revenues
generated by Google websites and Google Network Members’ websites and, to a lesser extent, an increase in other
revenues, largely as a result of the launch of our mobile phone business in the first quarter of 2010. The increase in
advertising revenue for Google websites and Google Network Members’ websites from 2009 to 2010 resulted
primarily from an increase in the number of paid clicks through our advertising programs and, to a lesser extent, an
increase in the average cost-per-click paid by our advertisers. The increase in the number of paid clicks generated
through our advertising programs was due to an increase in aggregate traffic, certain monetization improvements,
including new ad formats, and the continued global expansion of our products, and our advertiser and user base, as
well as an increase in the number of Google Network Members. The increase in the average cost-per-click paid by
our advertisers was primarily driven by the increased spending from advertisers, partially offset by the changes in
geographical mix due to traffic growth in emerging markets, where the average cost-per-click is typically lower,
compared to more mature markets.
30