Google 2011 Annual Report Download - page 69
Download and view the complete annual report
Please find page 69 of the 2011 Google annual report below. You can navigate through the pages in the report by either clicking on the pages listed below, or by using the keyword search tool below to find specific information within the annual report.-
 1
1 -
2
-
3
-
4
-
5
-
6
-
7
-
8
-
9
-
10
-
11
-
12
-
13
-
14
-
15
-
16
-
17
-
18
-
19
-
20
-
21
-
22
-
23
-
24
-
25
-
26
-
27
-
28
-
29
-
30
-
31
-
32
-
33
-
34
-
35
-
36
-
37
-
38
-
39
-
40
-
41
-
42
-
43
-
44
-
45
-
46
-
47
-
48
-
49
-
50
-
51
-
52
-
53
-
54
-
55
-
56
-
57
-
58
-
 59
59 -
 60
60 -
 61
61 -
 62
62 -
 63
63 -
 64
64 -
 65
65 -
 66
66 -
 67
67 -
 68
68 -
 69
69 -
 70
70 -
 71
71 -
 72
72 -
 73
73 -
 74
74 -
 75
75 -
 76
76 -
 77
77 -
 78
78 -
 79
79 -
80
-
81
-
82
-
83
-
84
-
85
-
86
-
87
-
88
-
89
-
90
-
91
-
92
-
93
-
94
-
95
-
96
-
97
-
98
-
99
-
100
-
101
-
102
-
103
-
104
-
105
-
106
-
107
-
108
-
109
-
110
-
111
-
112
-
113
-
114
-
115
-
116
-
117
-
118
-
119
-
120
-
121
-
122
-
123
-
124
 |
 |
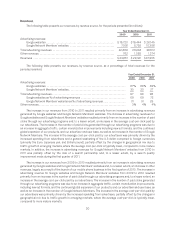
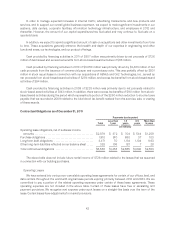
We have a debt financing program of up to $3.0 billion through the issuance of commercial paper. Net
proceeds from this program are used for general corporate purposes. As of December 31, 2011, we had $750
million of commercial paper outstanding recorded as short-term debt, with a weighted-average interest rate of
0.1%. Average commercial paper borrowings during the year were $1.4 billion and the maximum amount
outstanding during the year was $3.0 billion. In conjunction with this program, we have a $3.0 billion revolving
credit facility expiring in July 2016. The interest rate for the credit facility is determined based on a formula using
certain market rates. As of December 31, 2011, we were in compliance with the financial covenant in the credit
facility. No amounts were outstanding under the credit facility as of December 31, 2011.
Additionally, as of December 31, 2011, we had a $468 million secured promissory note outstanding recorded
as short-term debt, with an interest rate of 1.0% that matures in December 2012.
In May 2011, we issued $3.0 billion of unsecured senior notes in three equal tranches, due in 2014, 2016,
and 2021, with stated interest rates of 1.25%, 2.125%, and 3.625%. The net proceeds from the sale of the notes
were used to repay a portion of our outstanding commercial paper and for general corporate purposes. As of
December 31, 2011, the total carrying value and estimated fair value of these notes were $3.0 billion and $3.2
billion. The estimated fair value was based on quoted prices for our publicly-traded debt as of December 31, 2011.
We are not subject to any financial covenants under the notes. During 2011, we paid $35 million in interest
payments related to these notes.
In August 2011, we entered into a Merger Agreement with Motorola, a provider of innovative technologies,
products and services that enable a range of mobile and wireline digital communication, information and
entertainment experiences, under which we will acquire Motorola for $40 per share in cash, or a total of
approximately $12.5 billion. The completion of this transaction is subject to customary closing conditions, including
the receipt of certain regulatory approvals. In the event the Merger Agreement is terminated due to a failure to
obtain certain regulatory approvals, we would be required to pay Motorola a fee of $2.5 billion. The transaction is
currently expected to close in early 2012.
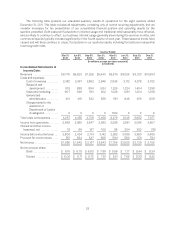
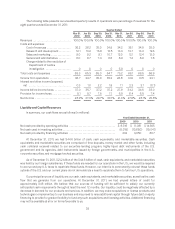
Cash provided by operating activities consist of net income adjusted for certain non-cash items, including
amortization, depreciation, deferred income taxes, excess tax benefits from stock-based award activities, stock-
based compensation expense, and impairment of equity investments, as well as the effect of changes in working
capital and other activities. Cash provided by operating activities in 2011 was $14,565 million and consisted of net
income of $9,737 million, adjustments for non-cash items of $4,198 million, and cash provided by working capital
and other activities of $630 million. Adjustments for non-cash items primarily consisted of $1,974 million of stock-
based compensation expense, $1,396 million of depreciation and amortization expense of property and equipment,
$455 million of amortization of intangible and other assets, $343 million of deferred income taxes, and $110
million related to impairment of equity investments. In addition, the increase in cash from changes in working
capital activities primarily consisted of an increase in accrued expenses and other liabilities of $795 million, a net
increase in income taxes payable and deferred income taxes of $731 million, an increase in accrued revenue share
of $259 million, an increase of $162 million in deferred revenue, and an increase of $101 million in accounts
payable. These increases were partially offset by an increase in accounts receivable of $1,156 million due to the
growth in fees billed to our advertisers, and an increase in prepaid revenue share, expenses and other assets of
$262 million. The increase in income taxes payable and deferred income taxes reflected primarily additional tax
obligations accrued, partially offset by estimated income taxes paid during 2011. In addition, we paid $500 million
related to the resolution of a Department of Justice investigation during the year.
Cash provided by operating activities in 2010 was $11,081 million, and consisted of net income of $8,505
million, adjustments for non-cash items of $2,675 million, and cash used in working capital and other activities of
$99 million. Adjustments for non-cash items primarily consisted of $1,376 million of stock-based compensation
expense, $1,067 million of depreciation and amortization expense on property and equipment, and $329 million of
amortization of intangible and other assets, partially offset by $94 million of excess tax benefits from stock-based
40