Google 2011 Annual Report Download - page 54
Download and view the complete annual report
Please find page 54 of the 2011 Google annual report below. You can navigate through the pages in the report by either clicking on the pages listed below, or by using the keyword search tool below to find specific information within the annual report.-
 1
1 -
2
-
3
-
4
-
5
-
6
-
7
-
8
-
9
-
10
-
11
-
12
-
13
-
14
-
15
-
16
-
17
-
18
-
19
-
20
-
21
-
22
-
23
-
24
-
25
-
26
-
27
-
28
-
29
-
30
-
31
-
32
-
33
-
34
-
35
-
36
-
37
-
38
-
39
-
40
-
41
-
42
-
43
-
 44
44 -
 45
45 -
 46
46 -
 47
47 -
 48
48 -
 49
49 -
 50
50 -
 51
51 -
 52
52 -
 53
53 -
 54
54 -
 55
55 -
 56
56 -
 57
57 -
 58
58 -
 59
59 -
 60
60 -
 61
61 -
 62
62 -
 63
63 -
 64
64 -
65
-
66
-
67
-
68
-
69
-
70
-
71
-
72
-
73
-
74
-
75
-
76
-
77
-
78
-
79
-
80
-
81
-
82
-
83
-
84
-
85
-
86
-
87
-
88
-
89
-
90
-
91
-
92
-
93
-
94
-
95
-
96
-
97
-
98
-
99
-
100
-
101
-
102
-
103
-
104
-
105
-
106
-
107
-
108
-
109
-
110
-
111
-
112
-
113
-
114
-
115
-
116
-
117
-
118
-
119
-
120
-
121
-
122
-
123
-
124
 |
 |

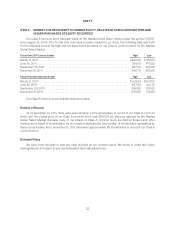
ITEM 6. SELECTED FINANCIAL DATA
You should read the following selected consolidated financial data in conjunction with Item 7 “Management’s
Discussion and Analysis of Financial Condition and Results of Operations” and our consolidated financial
statements and the related notes appearing in Item 8 “Financial Statements and Supplementary Data” of this
Annual Report on Form 10-K.
The consolidated statements of income data for the years ended December 31, 2009, 2010, and 2011 and the
consolidated balance sheet data at December 31, 2010, and 2011 are derived from our audited consolidated
financial statements appearing in Item 8 of this Annual Report on Form 10-K. The consolidated statements of
income data for the years ended December 31, 2007 and 2008, and the consolidated balance sheet data at
December 31, 2007, 2008, and 2009, are derived from our audited consolidated financial statements that are not
included in this Annual Report on Form 10-K. The historical results are not necessarily indicative of the results to
be expected in any future period.
Year Ended December 31,
2007 2008 2009 2010 2011
(in millions, except per share amounts)
Consolidated Statements of Income Data:
Revenues ......................................... $16,594 $ 21,796 $ 23,651 $ 29,321 $37,905
Income from operations ............................. 5,084 6,632 8,312 10,381 11,742
Net income ........................................ 4,204 4,227 6,520 8,505 9,737
Net income per share of Class A and Class B
common stock
Basic ......................................... $ 13.53 $ 13.46 $ 20.62 $ 26.69 $ 30.17
Diluted ....................................... $ 13.29 $ 13.31 $ 20.41 $ 26.31 $ 29.76
As of December 31,
2007 2008 2009 2010 2011
(in millions)
Consolidated Balance Sheet Data:
Cash, cash equivalents, and marketable securities ...... $ 14,219 $ 15,846 $24,485 $34,975 $44,626
Total assets ....................................... 25,336 31,768 40,497 57,851 72,574
Total long-term liabilities ............................ 611 1,227 1,746 1,614 5,516
Total stockholders’ equity ........................... 22,690 28,239 36,004 46,241 58,145
25