Google 2011 Annual Report Download - page 67
Download and view the complete annual report
Please find page 67 of the 2011 Google annual report below. You can navigate through the pages in the report by either clicking on the pages listed below, or by using the keyword search tool below to find specific information within the annual report.-
 1
1 -
2
-
3
-
4
-
5
-
6
-
7
-
8
-
9
-
10
-
11
-
12
-
13
-
14
-
15
-
16
-
17
-
18
-
19
-
20
-
21
-
22
-
23
-
24
-
25
-
26
-
27
-
28
-
29
-
30
-
31
-
32
-
33
-
34
-
35
-
36
-
37
-
38
-
39
-
40
-
41
-
42
-
43
-
44
-
45
-
46
-
47
-
48
-
49
-
50
-
51
-
52
-
53
-
54
-
55
-
56
-
 57
57 -
 58
58 -
 59
59 -
 60
60 -
 61
61 -
 62
62 -
 63
63 -
 64
64 -
 65
65 -
 66
66 -
 67
67 -
 68
68 -
 69
69 -
 70
70 -
 71
71 -
 72
72 -
 73
73 -
 74
74 -
 75
75 -
 76
76 -
 77
77 -
78
-
79
-
80
-
81
-
82
-
83
-
84
-
85
-
86
-
87
-
88
-
89
-
90
-
91
-
92
-
93
-
94
-
95
-
96
-
97
-
98
-
99
-
100
-
101
-
102
-
103
-
104
-
105
-
106
-
107
-
108
-
109
-
110
-
111
-
112
-
113
-
114
-
115
-
116
-
117
-
118
-
119
-
120
-
121
-
122
-
123
-
124
 |
 |

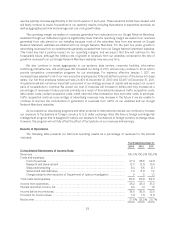
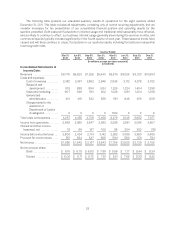
The following table presents our unaudited quarterly results of operations for the eight quarters ended
December 31, 2011. This table includes all adjustments, consisting only of normal recurring adjustments, that we
consider necessary for fair presentation of our consolidated financial position and operating results for the
quarters presented. Both seasonal fluctuations in internet usage and traditional retail seasonality have affected,
and are likely to continue to affect, our business. Internet usage generally slows during the summer months, and
commercial queries typically increase significantly in the fourth quarter of each year. These seasonal trends have
caused and will likely continue to cause, fluctuations in our quarterly results, including fluctuations in sequential
revenue growth rates.
Quarter Ended
Mar 31,
2010 Jun 30,
2010 Sep 30,
2010 Dec 31,
2010 Mar 31,
2011 Jun 30,
2011 Sep 30,
2011 Dec 31,
2011
(In millions, except per share amounts)
(unaudited)
Consolidated Statements of
Income Data:
Revenues ................... $6,775 $6,820 $7,286 $8,440 $8,575 $9,026 $9,720 $10,584
Costs and expenses:
Cost of revenues ......... 2,452 2,467 2,552 2,946 2,936 3,172 3,378 3,702
Research and
development .......... 818 898 994 1,051 1,226 1,234 1,404 1,298
Sales and marketing ..... 607 629 661 902 1,026 1,091 1,204 1,268
General and
administrative ......... 410 461 532 559 591 648 676 809
Charge related to the
resolution of
Department of Justice
investigation .......... 0 0 0 0 500 0 0 0
Total costs and expenses ...... 4,287 4,455 4,739 5,458 6,279 6,145 6,662 7,077
Income from operations ....... 2,488 2,365 2,547 2,982 2,296 2,881 3,058 3,507
Interest and other income
(expense), net ............. 18 69 167 160 96 204 302 (18)
Income before income taxes . . . 2,506 2,434 2,714 3,142 2,392 3,085 3,360 3,489
Provision for income taxes .... 551 594 547 599 594 580 631 784
Net income .................. $1,955 $ 1,840 $ 2,167 $ 2,543 $ 1,798 $2,505 $ 2,729 $ 2,705
Net income per share:
Basic ................... $ 6.15 $ 5.78 $ 6.80 $ 7.95 $ 5.59 $ 7.77 $ 8.44 $ 8.34
Diluted ................. $ 6.06 $ 5.71 $ 6.72 $ 7.81 $ 5.51 $ 7.68 $ 8.33 $ 8.22
38