Google 2011 Annual Report Download - page 58
Download and view the complete annual report
Please find page 58 of the 2011 Google annual report below. You can navigate through the pages in the report by either clicking on the pages listed below, or by using the keyword search tool below to find specific information within the annual report.
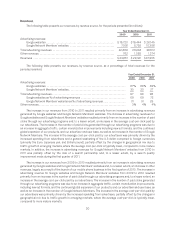
queries typically increase significantly in the fourth quarter of each year. These seasonal trends have caused, and
will likely continue to cause, fluctuations in our quarterly results, including fluctuations in sequential revenues, as
well as aggregate paid click and average cost-per-click growth rates.
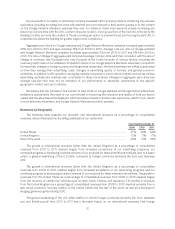
The operating margin we realize on revenues generated from ads placed on our Google Network Members’
websites through our AdSense program is significantly lower than the operating margin we realize from revenues
generated from ads placed on our websites because most of the advertiser fees from ads served on Google
Network Members’ websites are shared with our Google Network Members. For the past five years, growth in
advertising revenues from our websites has generally exceeded that from our Google Network Members’ websites.
This trend has had a positive impact on our operating margins, and we expect that this will continue for the
foreseeable future, although the relative rate of growth in revenues from our websites compared to the rate of
growth in revenues from our Google Network Members’ websites may vary over time.
We also continue to invest aggressively in our systems, data centers, corporate facilities, information
technology infrastructure, and employees. We increased our hiring in 2011, and we may continue to do so and to
provide competitive compensation programs for our employees. For instance, effective January 1, 2011, we
increased base salaries for all of our non-executive employees by 10% and shifted a portion of the bonus into base
salary. Our full-time employee headcount was 24,400 at December 31, 2010 and 32,467 at December 31, 2011.
Acquisitions will also remain an important component of our strategy and use of capital, and we expect our current
pace of acquisitions to continue. We expect our cost of revenues will increase in dollars and may increase as a
percentage of revenues in future periods, primarily as a result of forecasted increases in traffic acquisition costs,
data center costs, content acquisition costs, credit card and other transaction fees, and other costs. In particular,
traffic acquisition costs as a percentage of advertising revenues may increase in the future if we are unable to
continue to improve the monetization or generation of revenues from traffic on our websites and our Google
Network Members’ websites.
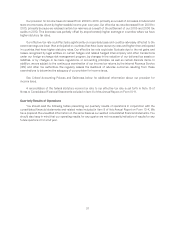
As we expand our advertising programs and other products to international markets, we continue to increase
our exposure to fluctuations in foreign currency to U.S. dollar exchange rates. We have a foreign exchange risk
management program that is designed to reduce our exposure to fluctuations in foreign currency exchange rates.
However, this program will not fully offset the effect of fluctuations on our revenues and earnings.
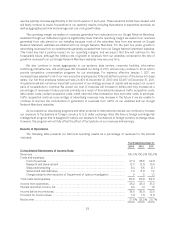
Results of Operations
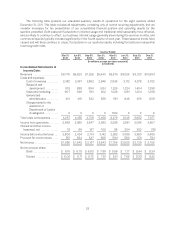
The following table presents our historical operating results as a percentage of revenues for the periods
indicated:
Year Ended December 31,
2009 2010 2011
Consolidated Statements of Income Data:
Revenues ...................................................................... 100.0% 100.0% 100.0%
Costs and expenses:
Cost of revenues ........................................................... 37.4 35.5 34.8
Research and development .................................................. 12.0 12.8 13.6
Sales and marketing ........................................................ 8.4 9.5 12.1
General and administrative ................................................... 7.0 6.8 7.2
Charge related to the resolution of Department of Justice investigation ............ 0 0 1.3
Total costs and expenses ........................................................ 64.8 64.6 69.0
Income from operations .......................................................... 35.2 35.4 31.0
Interest and other income, net .................................................... 0.3 1.4 1.5
Income before income taxes ...................................................... 35.5 36.8 32.5
Provision for income taxes ....................................................... 7.9 7.8 6.8
Net income ..................................................................... 27.6% 29.0% 25.7%
29


