Google 2011 Annual Report Download - page 60
Download and view the complete annual report
Please find page 60 of the 2011 Google annual report below. You can navigate through the pages in the report by either clicking on the pages listed below, or by using the keyword search tool below to find specific information within the annual report.-
 1
1 -
2
-
3
-
4
-
5
-
6
-
7
-
8
-
9
-
10
-
11
-
12
-
13
-
14
-
15
-
16
-
17
-
18
-
19
-
20
-
21
-
22
-
23
-
24
-
25
-
26
-
27
-
28
-
29
-
30
-
31
-
32
-
33
-
34
-
35
-
36
-
37
-
38
-
39
-
40
-
41
-
42
-
43
-
44
-
45
-
46
-
47
-
48
-
49
-
 50
50 -
 51
51 -
 52
52 -
 53
53 -
 54
54 -
 55
55 -
 56
56 -
 57
57 -
 58
58 -
 59
59 -
 60
60 -
 61
61 -
 62
62 -
 63
63 -
 64
64 -
 65
65 -
 66
66 -
 67
67 -
 68
68 -
 69
69 -
 70
70 -
71
-
72
-
73
-
74
-
75
-
76
-
77
-
78
-
79
-
80
-
81
-
82
-
83
-
84
-
85
-
86
-
87
-
88
-
89
-
90
-
91
-
92
-
93
-
94
-
95
-
96
-
97
-
98
-
99
-
100
-
101
-
102
-
103
-
104
-
105
-
106
-
107
-
108
-
109
-
110
-
111
-
112
-
113
-
114
-
115
-
116
-
117
-
118
-
119
-
120
-
121
-
122
-
123
-
124
 |
 |

Improvements in our ability to ultimately monetize increased traffic primarily relate to enhancing the end user
experience, including providing end users with ads that are more relevant to their search queries or to the content
on the Google Network Members’ websites they visit. For instance, these improvements include increasing site
links to be full size links with the URL (uniform resource locator), moving a portion of the first line of the ad to the
heading to better promote the content of the ad, providing an option to preview the ad, and moving the ad’s URL to
a separate line below the heading for greater page format consistency.
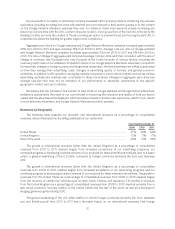
Aggregate paid clicks on Google websites and Google Network Members’ websites increased approximately
25% from 2010 to 2011 and approximately 16% from 2009 to 2010. Average cost-per-click on Google websites
and Google Network Members’ websites increased approximately 3% from 2010 to 2011 and 5% from 2009 to
2010. The rate of change in aggregate paid clicks and average cost-per-click, and their correlation with the rate of
change in revenues, has fluctuated and may fluctuate in the future because of various factors, including the
revenue growth rates on our websites compared to those of our Google Network Members, advertiser competition
for keywords, changes in foreign currency exchange rates, seasonality, the fees advertisers are willing to pay based
on how they manage their advertising costs, changes in advertising quality or formats, and general economic
conditions. In addition, traffic growth in emerging markets compared to more mature markets and across various
advertising verticals and channels also contributes to these fluctuations. Changes in aggregate paid clicks and
average cost-per-click may not be indicative of our performance or advertiser experiences in any specific
geographic market, vertical, or industry.
We believe that the increase in the number of paid clicks on Google websites and Google Network Members’
websites is substantially the result of our commitment to improving the relevance and quality of both our search
results and the advertisements displayed, which we believe results in a better user experience, which in turn results
in more searches, advertisers, and Google Network Members and other partners.
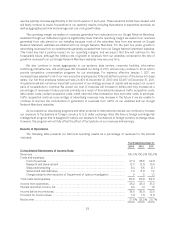
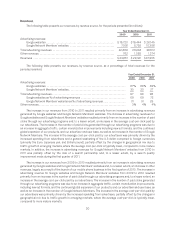
Revenues by Geography
The following table presents our domestic and international revenues as a percentage of consolidated
revenues, determined based on the billing addresses of our customers:
Year Ended December 31,
2009 2010 2011
United States ................................................................... 47% 48% 46%
United Kingdom ................................................................. 13% 11% 11%
Rest of the world ................................................................ 40% 41% 43%
The growth in international revenues (other than the United Kingdom) as a percentage of consolidated
revenues from 2010 to 2011 resulted largely from increased acceptance of our advertising programs, our
continued progress in developing localized versions of our products for these international markets, and, to a lesser
extent, a general weakening of the U.S dollar compared to foreign currencies (primarily the Euro and Japanese
yen).
The growth in international revenues (other than the United Kingdom) as a percentage of consolidated
revenues from 2009 to 2010 resulted largely from increased acceptance of our advertising programs and our
continued progress in developing localized versions of our products for these international markets. The growth in
revenues from the United States as a percentage of consolidated revenues from 2009 to 2010 resulted largely
from the recovery of certain key verticals such as retail, travel, finance, and insurance. The decline in revenues
from the United Kingdom as a percentage of consolidated revenues from 2009 to 2010 resulted primarily from a
less robust economic recovery relative to the United States and the rest of the world, as well as a decrease in
hedging gains recognized during 2010.
The general weakening of the U.S. dollar relative to certain foreign currencies (primarily the Euro, Japanese
yen, and British pound) from 2010 to 2011 had a favorable impact on our international revenues. Had foreign
31