Google 2011 Annual Report Download - page 91
Download and view the complete annual report
Please find page 91 of the 2011 Google annual report below. You can navigate through the pages in the report by either clicking on the pages listed below, or by using the keyword search tool below to find specific information within the annual report.-
 1
1 -
2
-
3
-
4
-
5
-
6
-
7
-
8
-
9
-
10
-
11
-
12
-
13
-
14
-
15
-
16
-
17
-
18
-
19
-
20
-
21
-
22
-
23
-
24
-
25
-
26
-
27
-
28
-
29
-
30
-
31
-
32
-
33
-
34
-
35
-
36
-
37
-
38
-
39
-
40
-
41
-
42
-
43
-
44
-
45
-
46
-
47
-
48
-
49
-
50
-
51
-
52
-
53
-
54
-
55
-
56
-
57
-
58
-
59
-
60
-
61
-
62
-
63
-
64
-
65
-
66
-
67
-
68
-
69
-
70
-
71
-
72
-
73
-
74
-
75
-
76
-
77
-
78
-
79
-
80
-
 81
81 -
 82
82 -
 83
83 -
 84
84 -
 85
85 -
 86
86 -
 87
87 -
 88
88 -
 89
89 -
 90
90 -
 91
91 -
 92
92 -
 93
93 -
 94
94 -
 95
95 -
 96
96 -
 97
97 -
 98
98 -
 99
99 -
 100
100 -
 101
101 -
102
-
103
-
104
-
105
-
106
-
107
-
108
-
109
-
110
-
111
-
112
-
113
-
114
-
115
-
116
-
117
-
118
-
119
-
120
-
121
-
122
-
123
-
124
 |
 |

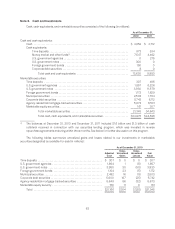
The following table sets forth the computation of basic and diluted net income per share of Class A and Class B
common stock (in millions, except share amounts which are reflected in thousands and per share amounts):
Year Ended December 31,
2009 2010 2011
Class A Class B Class A Class B Class A Class B
Basic net income per share:
Numerator
Allocation of undistributed earnings ............. $ 4,981 $ 1,539 $ 6,569 $ 1,936 $ 7,658 $ 2,079
Denominator
Weighted-average common shares outstanding . . 241,575 74,651 246,168 72,534 253,862 68,916
Less: Weighted-average unvested common
shares subject to repurchase or
cancellation .............................. (5) 0 0 0 0 0
Number of shares used in per share
computation ........................... 241,570 74,651 246,168 72,534 253,862 68,916
Basic net income per share ......................... $ 20.62 $ 20.62 $ 26.69 $ 26.69 $ 30.17 $ 30.17
Diluted net income per share:
Numerator
Allocation of undistributed earnings for basic
computation ............................... $ 4,981 $ 1,539 $ 6,569 $ 1,936 $ 7,658 $ 2,079
Reallocation of undistributed earnings as a result
of conversion of Class B to Class A shares ..... 1,539 0 1,936 0 2,079 0
Reallocation of undistributed earnings to Class B
shares ..................................... 0 (13) 0 (26) 0 (27)
Allocation of undistributed earnings ............. $ 6,520 $ 1,526 $ 8,505 $ 1,910 $ 9,737 $ 2,052
Denominator
Number of shares used in basic computation ..... 241,570 74,651 246,168 72,534 253,862 68,916
Weighted-average effect of dilutive securities .....
Add:
Conversion of Class B to Class A common
shares outstanding ................... 74,651 0 72,534 0 68,916 0
Unvested common shares subject to
repurchase or cancellation ............ 5 0 0 0 0 0
Employee stock options, including warrants
issued under Transferable Stock Option
program ............................ 2,569 114 3,410 71 2,958 46
Restricted shares and RSUs ............. 621 0 1,139 0 1,478 0
Number of shares used in per share
computation ...................... 319,416 74,765 323,251 72,605 327,214 68,962
Diluted net income per share ........................ $ 20.41 $ 20.41 $ 26.31 $ 26.31 $ 29.76 $ 29.76
The net income per share amounts are the same for Class A and Class B common stock because the holders of
each class are legally entitled to equal per share distributions whether through dividends or in liquidation.
62