Google 2011 Annual Report Download - page 63
Download and view the complete annual report
Please find page 63 of the 2011 Google annual report below. You can navigate through the pages in the report by either clicking on the pages listed below, or by using the keyword search tool below to find specific information within the annual report.-
 1
1 -
2
-
3
-
4
-
5
-
6
-
7
-
8
-
9
-
10
-
11
-
12
-
13
-
14
-
15
-
16
-
17
-
18
-
19
-
20
-
21
-
22
-
23
-
24
-
25
-
26
-
27
-
28
-
29
-
30
-
31
-
32
-
33
-
34
-
35
-
36
-
37
-
38
-
39
-
40
-
41
-
42
-
43
-
44
-
45
-
46
-
47
-
48
-
49
-
50
-
51
-
52
-
 53
53 -
 54
54 -
 55
55 -
 56
56 -
 57
57 -
 58
58 -
 59
59 -
 60
60 -
 61
61 -
 62
62 -
 63
63 -
 64
64 -
 65
65 -
 66
66 -
 67
67 -
 68
68 -
 69
69 -
 70
70 -
 71
71 -
 72
72 -
 73
73 -
74
-
75
-
76
-
77
-
78
-
79
-
80
-
81
-
82
-
83
-
84
-
85
-
86
-
87
-
88
-
89
-
90
-
91
-
92
-
93
-
94
-
95
-
96
-
97
-
98
-
99
-
100
-
101
-
102
-
103
-
104
-
105
-
106
-
107
-
108
-
109
-
110
-
111
-
112
-
113
-
114
-
115
-
116
-
117
-
118
-
119
-
120
-
121
-
122
-
123
-
124
 |
 |

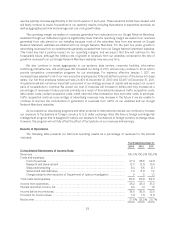
• The relative growth rates of expenses associated with distribution arrangements and the related revenues
generated, including whether we share with certain existing and new distribution partners proportionately
more of the aggregate advertising fees that we earn from paid clicks derived from search queries these
partners direct to our websites.
Research and Development
The following table presents our research and development expenses, and research and development
expenses as a percentage of our revenues for the periods presented (dollars in millions):
Year Ended December 31,
2009 2010 2011
Research and development expenses .......................................... $2,843 $3,762 $5,162
Research and development expenses as a percentage of revenues ................ 12.0% 12.8% 13.6%
Research and development expenses consist primarily of compensation and related costs for personnel
responsible for the research and development of new and existing products and services. We expense research
and development costs as they are incurred.
Research and development expenses increased $1,400 million from 2010 to 2011. This increase was primarily
due to an increase in labor and facilities-related costs of $875 million, largely as a result of a 23% increase in
research and development headcount, including headcount from acquisitions, as well as an increase in employee
base salaries of approximately 10%. In addition, there was an increase in stock-based compensation expense of
$200 million.
Research and development expenses increased $919 million from 2009 to 2010. This increase was primarily
due to an increase in labor-related costs of $578 million, largely as a result of a 28% increase in research and
development headcount, including headcount from acquisitions. In addition, there was an increase in stock-based
compensation expense of $136 million.
We expect that research and development expenses will increase in dollar amount and may increase as a
percentage of revenues in 2012 and future periods because we expect to continue to invest in building the
necessary employee and systems infrastructures required to support the development of new, and improve
existing, products and services.
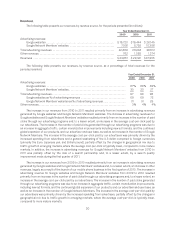
Sales and Marketing
The following table presents our sales and marketing expenses, and sales and marketing expenses as a
percentage of revenues for the periods presented (dollars in millions):
Year Ended December 31,
2009 2010 2011
Sales and marketing expenses ................................................ $1,984 $2,799 $4,589
Sales and marketing expenses as a percentage of revenues ...................... 8.4% 9.5% 12.1%
Sales and marketing expenses consist primarily of compensation and related costs for personnel engaged in
customer service, sales, and sales support functions, as well as advertising and promotional expenditures.
Sales and marketing expenses increased $1,790 million from 2010 to 2011. This increase was primarily due to
an increase in labor and facilities-related costs of $787 million, largely as a result of a 36% increase in sales and
marketing headcount, including headcount from acquisitions, as well as an increase in employee base salaries of
approximately 10%. In addition, there was an increase in advertising and promotional expense of $700 million.
34